Unlock a world of possibilities! Login now and discover the exclusive benefits awaiting you.
- Qlik Community
- :
- All Forums
- :
- QlikView App Dev
- :
- Accumulation Issue - Help required!
- Subscribe to RSS Feed
- Mark Topic as New
- Mark Topic as Read
- Float this Topic for Current User
- Bookmark
- Subscribe
- Mute
- Printer Friendly Page
- Mark as New
- Bookmark
- Subscribe
- Mute
- Subscribe to RSS Feed
- Permalink
- Report Inappropriate Content
Accumulation Issue - Help required!
Hi all,
I have an issue that I have tried numerous ways to overcome but to no avail so I need the assistance of an expert!
I have chart that I am displaying as line graph and in this chart I have a value called Contract value which is a flat line across all months as the value never changes.
I want to show the Balance to complete the project which is worked out by the calculation: contract value - costs to date
I tried to then tick the accumulation tick box against that expression so that the costs are accumulated and hence the line should go down from left to right.
My issue is that this also accumulates the contract value data. Is there a way to essentially amend my calculation so that it does contact value - accumulated(costs to date) rather than accumulating it all?
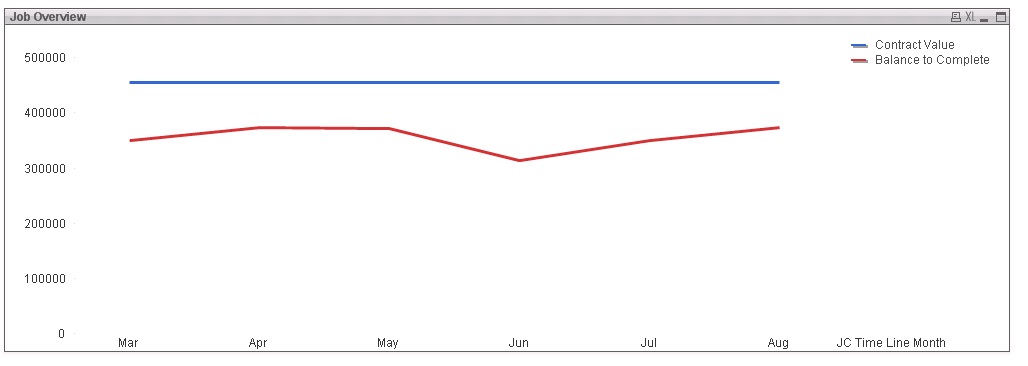
This is how my chart shows when I don't tick the accumulate and you can see here it is taking off the cost of each month from the total contract value.
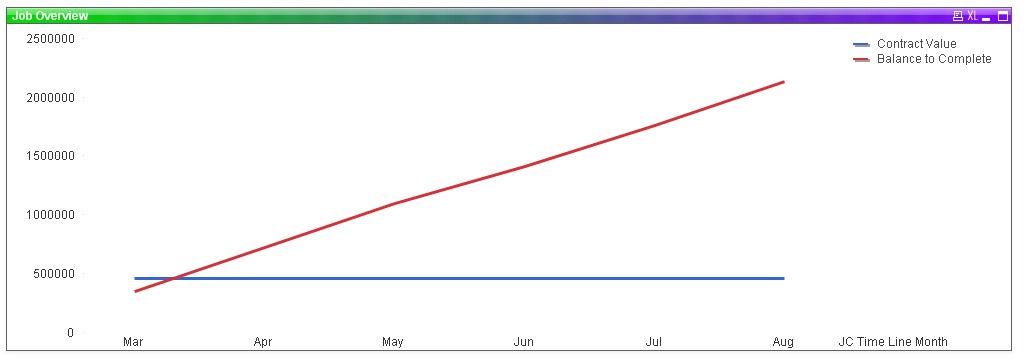
When I accumulate the expression it then shows like this (which is not what I want because it is accumulating the contract value as well):
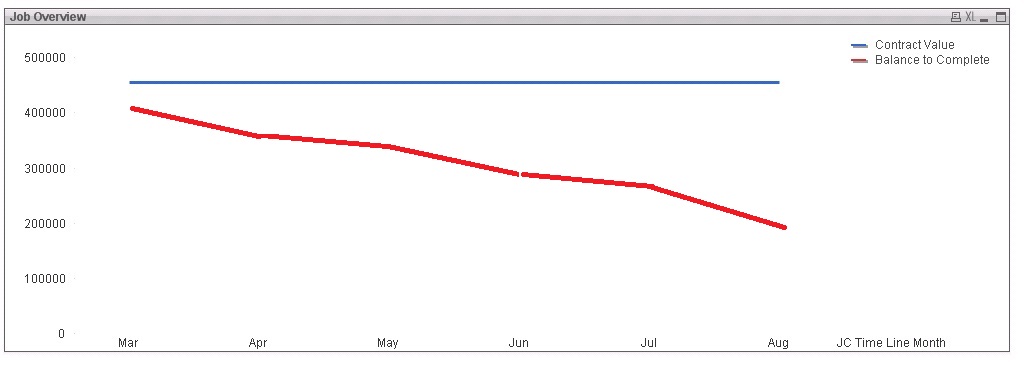
I would really like it to display similar to the below graph and it is this I don't know how to acheive, any assistance would be greatly appreciated!
Many thanks
Ben
Accepted Solutions
- Mark as New
- Bookmark
- Subscribe
- Mute
- Subscribe to RSS Feed
- Permalink
- Report Inappropriate Content
Hi.
Use "manual accumulation".
=[contact value] - rangesum(above([costs to date],0, rowno()))
- Mark as New
- Bookmark
- Subscribe
- Mute
- Subscribe to RSS Feed
- Permalink
- Report Inappropriate Content
Hi.
Use "manual accumulation".
=[contact value] - rangesum(above([costs to date],0, rowno()))
- Mark as New
- Bookmark
- Subscribe
- Mute
- Subscribe to RSS Feed
- Permalink
- Report Inappropriate Content
Its so easy when you know how! Thank you so much for that ... learn something everyday!