Unlock a world of possibilities! Login now and discover the exclusive benefits awaiting you.
- Qlik Community
- :
- All Forums
- :
- QlikView App Dev
- :
- Adding a Target Line onto a graph
- Subscribe to RSS Feed
- Mark Topic as New
- Mark Topic as Read
- Float this Topic for Current User
- Bookmark
- Subscribe
- Mute
- Printer Friendly Page
- Mark as New
- Bookmark
- Subscribe
- Mute
- Subscribe to RSS Feed
- Permalink
- Report Inappropriate Content
Adding a Target Line onto a graph
Hi All,
I have a graph which i has a dimension of 0, 1-10, 11-20 etc. i want to put a vertical line on the graph at 56 as that is the target to be under.
Do you know how this can be done?
Thanks
Laura
- Mark as New
- Bookmark
- Subscribe
- Mute
- Subscribe to RSS Feed
- Permalink
- Report Inappropriate Content
Hi,
Add a reference line with the value 56.
Chart properties-->Presentation tab-->Reference lines click add.
Celambarasan
- Mark as New
- Bookmark
- Subscribe
- Mute
- Subscribe to RSS Feed
- Permalink
- Report Inappropriate Content
i have tried that but it goes horizontal and i want it vertical
- Mark as New
- Bookmark
- Subscribe
- Mute
- Subscribe to RSS Feed
- Permalink
- Report Inappropriate Content
Hi,
Can you attach the sample or screenshot. Check the attachment, hope it helps you.
Regards,
Jagan.
- Mark as New
- Bookmark
- Subscribe
- Mute
- Subscribe to RSS Feed
- Permalink
- Report Inappropriate Content
The problem is in the reference line i need to select continous x but it is blank out.
- Mark as New
- Bookmark
- Subscribe
- Mute
- Subscribe to RSS Feed
- Permalink
- Report Inappropriate Content
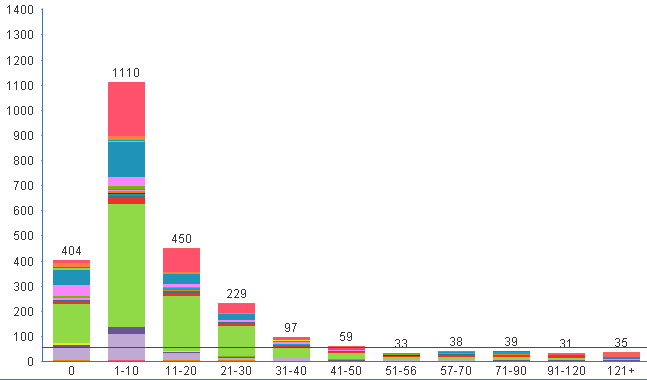
this is want happens which i do exactly the same thing as you advised. i want the red line to be vertical where you can see on the x axis it says 56.
- Mark as New
- Bookmark
- Subscribe
- Mute
- Subscribe to RSS Feed
- Permalink
- Report Inappropriate Content
Hi,
You will get the Reference Line, based on the expression, if the expression values is on Y axis then you will get horizontally. If your expression is on X axis then you will get the Reference line vertically. That is why you can see the option Continuous X option is disabled. Since you have calculated values(Expression) is on Y.
Regards,
Jagan.
- Mark as New
- Bookmark
- Subscribe
- Mute
- Subscribe to RSS Feed
- Permalink
- Report Inappropriate Content
What do i need to right in the expression box to be able to enable the x axis?