Unlock a world of possibilities! Login now and discover the exclusive benefits awaiting you.
- Qlik Community
- :
- All Forums
- :
- QlikView App Dev
- :
- Adding another dimension on chart
Options
- Subscribe to RSS Feed
- Mark Topic as New
- Mark Topic as Read
- Float this Topic for Current User
- Bookmark
- Subscribe
- Mute
- Printer Friendly Page
Turn on suggestions
Auto-suggest helps you quickly narrow down your search results by suggesting possible matches as you type.
Showing results for
Creator
2017-01-12
06:50 AM
- Mark as New
- Bookmark
- Subscribe
- Mute
- Subscribe to RSS Feed
- Permalink
- Report Inappropriate Content
Adding another dimension on chart
Hi there,
I'm trying to add a dimension on the right of the graph that has a scale that the line can read off.
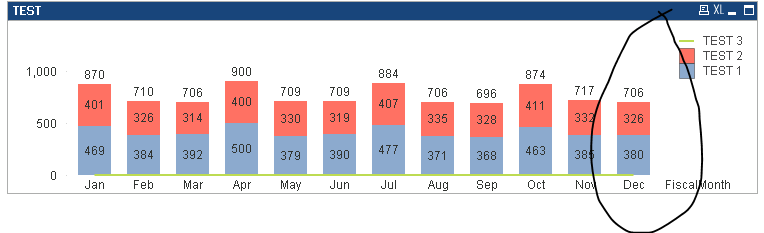
As the green line has a different scale to what the bars are reading from on the left.
Is this possible in QlikView?
1,997 Views
1 Solution
Accepted Solutions
MVP
2017-01-12
07:04 AM
- Mark as New
- Bookmark
- Subscribe
- Mute
- Subscribe to RSS Feed
- Permalink
- Report Inappropriate Content
You just need to create a axis on the right which can be done on the Axes tab. Check this link out:
1,939 Views
2 Replies
Not applicable
2017-01-12
06:52 AM
- Mark as New
- Bookmark
- Subscribe
- Mute
- Subscribe to RSS Feed
- Permalink
- Report Inappropriate Content
Please share us a sample file and elaborate your requirement clearly.
1,939 Views
MVP
2017-01-12
07:04 AM
- Mark as New
- Bookmark
- Subscribe
- Mute
- Subscribe to RSS Feed
- Permalink
- Report Inappropriate Content
You just need to create a axis on the right which can be done on the Axes tab. Check this link out:
1,940 Views