Unlock a world of possibilities! Login now and discover the exclusive benefits awaiting you.
- Qlik Community
- :
- All Forums
- :
- QlikView App Dev
- :
- Adding data of prev. years or aggregating prev. ye...
- Subscribe to RSS Feed
- Mark Topic as New
- Mark Topic as Read
- Float this Topic for Current User
- Bookmark
- Subscribe
- Mute
- Printer Friendly Page
- Mark as New
- Bookmark
- Subscribe
- Mute
- Subscribe to RSS Feed
- Permalink
- Report Inappropriate Content
Adding data of prev. years or aggregating prev. years data into current year
Hi,
Not sure the subject is relevant. I want to achieve following results:
I have data sampled from past year till this year. But when displaying the data either in a graph or a pivot ,I am displaying only current year and months. For which the appropriate data is getting displayed. What I want is the prev. years data should be aggregated i.e added up into this data and displayed.
In the attached ex. there is a policy count of 117 till dec. 2011. And for month of Jan 2012 the count is 22, for feb 2012 it is 58 and so on...
When the graph is displayed for Jan 2012,Feb 2012 on x axis and policy count on y axis. I could see 22 and 58, there is a 219 policy count shown under no date i.e blank. When I suppress the blanks this count ( 219) disappears. This count of 219 should be added up in the count of jan 2012. as illustrated below.
In the graph I should see for Jan 2012 the count of (219+22=241) for feb 2012 ( 241+58=299) etc.
In the pivot I should see for Jan 2012 and for the dimension (keyagebucket) ( 13+5 = 18) for feb 2012 ( 18+4=22) etc
Please help how can this be achieved.
Thanks
Lax
- « Previous Replies
- Next Replies »
- Mark as New
- Bookmark
- Subscribe
- Mute
- Subscribe to RSS Feed
- Permalink
- Report Inappropriate Content
Hi,
Try with this
if(DATE(EXTRACTIONDATE,'DD-MM-YYYY')<=Date#('31-03-2012','DD-MM-YYYY') and EXTRACTIONDATE>=MonthStart(Min(EXTRACTIONDATE),24),alt(above([surrendered policies]),0)+sum({<DATE_FYYYY= {$(CFYear)}>}MTD_SURR),0)
Celambarasan
- Mark as New
- Bookmark
- Subscribe
- Mute
- Subscribe to RSS Feed
- Permalink
- Report Inappropriate Content
Hi, This works but my first exp. goes for a toss !. it shows data from 2010-04...
Does it also require some changes.
Thanks,
Lax
- Mark as New
- Bookmark
- Subscribe
- Mute
- Subscribe to RSS Feed
- Permalink
- Report Inappropriate Content
Hi, how do I change my set analysis so both the exp. can be displayed properly.
Thanks,
Lax
- Mark as New
- Bookmark
- Subscribe
- Mute
- Subscribe to RSS Feed
- Permalink
- Report Inappropriate Content
Hi,
Post your expression that currently you are using?
Celambarasan
- Mark as New
- Bookmark
- Subscribe
- Mute
- Subscribe to RSS Feed
- Permalink
- Report Inappropriate Content
1.
Sum({<EXTRACTIONDATE={">=$(=MonthStart(Min(EXTRACTIONDATE),24))"}>}MTD_SURRABLE)
+Alt(Above([surrenderable policies]),$(=Sum({1<EXTRACTIONDATE={"<$(=
MonthStart(Min(EXTRACTIONDATE),24))"}>} MTD_SURRABLE)))
2.
if(DATE(EXTRACTIONDATE,'DD-MM-YYYY')<=Date#('31-03-2012','DD-MM-YYYY') and
EXTRACTIONDATE>=MonthStart(Min(EXTRACTIONDATE),24),
alt(above([surrendered policies]),0)+sum({<DATE_FYYYY= {$(CFYear)}>}MTD_SURR),0)
Thanks,
Lax
- Mark as New
- Bookmark
- Subscribe
- Mute
- Subscribe to RSS Feed
- Permalink
- Report Inappropriate Content
Hi,
Have you checked the Suppress zero values option?
Can you post the image of the graph how it look like?
Celambarasan
- Mark as New
- Bookmark
- Subscribe
- Mute
- Subscribe to RSS Feed
- Permalink
- Report Inappropriate Content
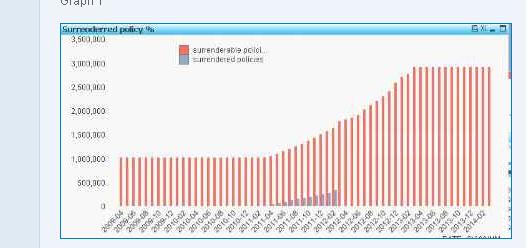
The above graph is what I get ( posted in one of my prev. replies).
- Mark as New
- Bookmark
- Subscribe
- Mute
- Subscribe to RSS Feed
- Permalink
- Report Inappropriate Content
Hi,
If possible try using Calculated dimension as
if(EXTRACTIONDATE>=MonthStart(Min(EXTRACTIONDATE),24),EXTRACTIONDATE)
Celambarasan
- Mark as New
- Bookmark
- Subscribe
- Mute
- Subscribe to RSS Feed
- Permalink
- Report Inappropriate Content
Hi,
In this case the graph starts properly ( from 2011) but ends in 2014. it should end at 2013.
Thanks
Lax
- « Previous Replies
- Next Replies »