Unlock a world of possibilities! Login now and discover the exclusive benefits awaiting you.
- Qlik Community
- :
- All Forums
- :
- QlikView App Dev
- :
- Addition to Pivot table
- Subscribe to RSS Feed
- Mark Topic as New
- Mark Topic as Read
- Float this Topic for Current User
- Bookmark
- Subscribe
- Mute
- Printer Friendly Page
- Mark as New
- Bookmark
- Subscribe
- Mute
- Subscribe to RSS Feed
- Permalink
- Report Inappropriate Content
Addition to Pivot table
Dear Friends
In the process of developing a Pivot table in my QV I find it difficult to add a few more columns to Pivot table
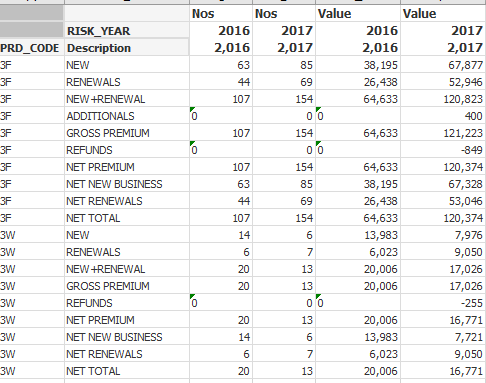
My original Pivot Table look like given below
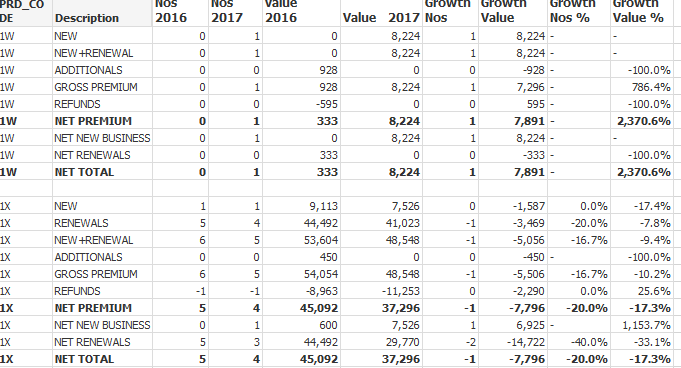
I want to add 4 more columns (red)to calculate the growth and output table should look like in the screen shot below
Pls help me to do it.
My sample QV doc is also attached h/w
- Mark as New
- Bookmark
- Subscribe
- Mute
- Subscribe to RSS Feed
- Permalink
- Report Inappropriate Content
Can someone pls suggest possible way of doing the above even changing my data model
- Mark as New
- Bookmark
- Subscribe
- Mute
- Subscribe to RSS Feed
- Permalink
- Report Inappropriate Content
What is the logic u want to use for the Growth in ur data?
- Mark as New
- Bookmark
- Subscribe
- Mute
- Subscribe to RSS Feed
- Permalink
- Report Inappropriate Content
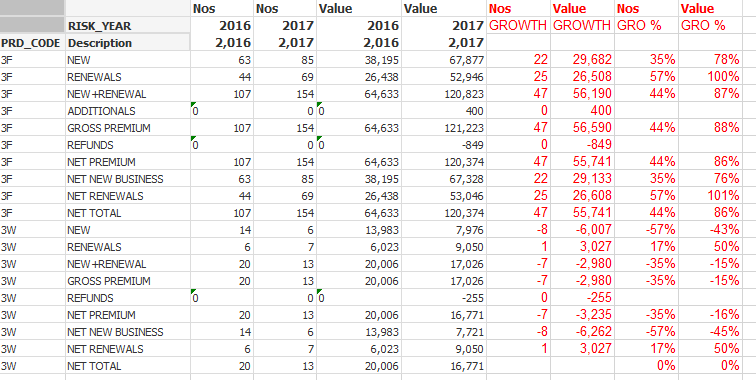
If you take top row
85-63=22(Nos Growth)
(22/63)*100 =35% Nos Gro %
That is logic Value as well
- Mark as New
- Bookmark
- Subscribe
- Mute
- Subscribe to RSS Feed
- Permalink
- Report Inappropriate Content
Hi Friends
I have tried and achieved my need and my out now is as shown below
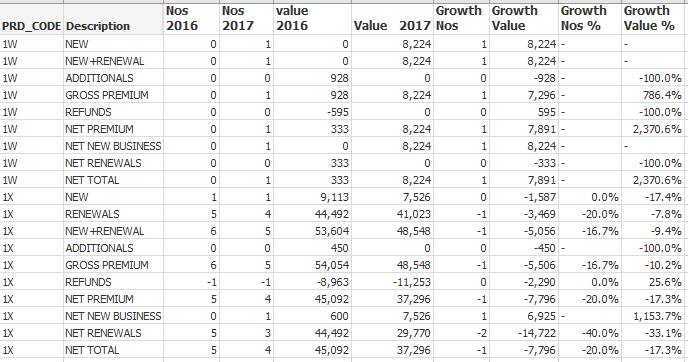
Now I want to do some modification to the report.
I want to add Blank row in between two Prd Code
I want bold two rows ( NET PREMIUM and NET TOTAL)
Sample of the report is shown below. I am unable to the modification pls help me