Unlock a world of possibilities! Login now and discover the exclusive benefits awaiting you.
- Qlik Community
- :
- All Forums
- :
- QlikView App Dev
- :
- Re: Aggr function in dimensionless bar chart
- Subscribe to RSS Feed
- Mark Topic as New
- Mark Topic as Read
- Float this Topic for Current User
- Bookmark
- Subscribe
- Mute
- Printer Friendly Page
- Mark as New
- Bookmark
- Subscribe
- Mute
- Subscribe to RSS Feed
- Permalink
- Report Inappropriate Content
Aggr function in dimensionless bar chart
Hello QlikView experts,
I am trying to create a bar chart with expression total and for that I am using Aggr function. Below is my code :-
SUM(
AGGR(
(SUM([Price] *
sum({$ <Year = {"$(=(max(Year)-1))"},
Month = {"$(=(month(today())))"}>}
#Units)
)
) , ITM_ID) )
Here I am multiplying Price by Units at the ITM_ID level and want to sum this on Location_ID Level. Location can be added as a dimension to the bar chart. I tried putting Location_ID in above expression but that did not help either.
For some reason it is giving me 0 in text object and is not showing up in the bar chart.
Would like to know any obvious suggestions/error just looking at the above expression?
Thanks
- Tags:
- aggr function
Accepted Solutions
- Mark as New
- Bookmark
- Subscribe
- Mute
- Subscribe to RSS Feed
- Permalink
- Report Inappropriate Content
is there a specific reason why you are not multiplying price by units ?
you could use total
sum(total <[Location_ID>{$ <Year = {"$(=(max(Year)-1))"},
Month = {"$(=(month(today())))"}>}
#Units*[Price])
- Mark as New
- Bookmark
- Subscribe
- Mute
- Subscribe to RSS Feed
- Permalink
- Report Inappropriate Content
AGGR function will work only on the dimension ...you need to have dimension without that it won't work
- Mark as New
- Bookmark
- Subscribe
- Mute
- Subscribe to RSS Feed
- Permalink
- Report Inappropriate Content
is there a specific reason why you are not multiplying price by units ?
you could use total
sum(total <[Location_ID>{$ <Year = {"$(=(max(Year)-1))"},
Month = {"$(=(month(today())))"}>}
#Units*[Price])
- Mark as New
- Bookmark
- Subscribe
- Mute
- Subscribe to RSS Feed
- Permalink
- Report Inappropriate Content
Hi Avinash, thanks for quick reply. I have added dimension in bar chart to test my expression. It does not come up with value still! In addition to this, I also tried to add the dimension in aggr expression, see below. No luck!
=
SUM(
AGGR(
(SUM([Price] *
sum({$ <Year = {"$(=(max(Year)-1))"},
Month = {"$(=(month(today())))"}>}
#Units)
)
) , ITM_ID,LOC_ID) )
What am I missing?
- Mark as New
- Bookmark
- Subscribe
- Mute
- Subscribe to RSS Feed
- Permalink
- Report Inappropriate Content
Hi Ramon, your expression is giving me some value so that is good and thanks for that! However it is different from what I am after. I am looking for sum product. Each unit value multiplied by price for that item will give me a value and I want to sum them up (for entire location.)
I have attached the spreadsheet to illustrate my requirement. Hope it is clear.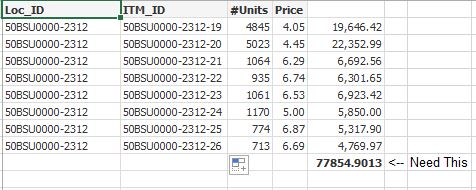
- Mark as New
- Bookmark
- Subscribe
- Mute
- Subscribe to RSS Feed
- Permalink
- Report Inappropriate Content
ok, so I assume price for the itm_id can be more than once
you could try by using two aggr
| aggr( |
SUM(
AGGR(
(SUM([Price] *
sum({$ <Year = {"$(=(max(Year)-1))"},
Month = {"$(=(month(today())))"}>}
#Units)
)
), ITM_ID)),LOC_ID)
or by using the total outside of the aggr
SUM(total <LOC_ID>
AGGR(
(SUM([Price] *
sum({$ <Year = {"$(=(max(Year)-1))"},
Month = {"$(=(month(today())))"}>}
#Units)
)
), ITM_ID))
- Mark as New
- Bookmark
- Subscribe
- Mute
- Subscribe to RSS Feed
- Permalink
- Report Inappropriate Content
Hi,
look at the attached sample.
Is this what you are looking for?
Patric
- Mark as New
- Bookmark
- Subscribe
- Mute
- Subscribe to RSS Feed
- Permalink
- Report Inappropriate Content
I think direct Unit and Price multiplication should work if you take Location as Dimension in Bar chart. See the attached based on your excel sheet. Perhaps it cannot be that simple, may be missing the point you want to explain 
- Mark as New
- Bookmark
- Subscribe
- Mute
- Subscribe to RSS Feed
- Permalink
- Report Inappropriate Content
Thanks for putting up a quick QVW Patric! Appreciate it. I see this is the same expression that Ramon shared and this is working for me as of now.
- Mark as New
- Bookmark
- Subscribe
- Mute
- Subscribe to RSS Feed
- Permalink
- Report Inappropriate Content
Thanks Digvijay. Yes you got it right. Just that in my case the units will actually be an aggregate of each item id (because there can be more than one item id in the table). I have used expression shared by Ramon.