Unlock a world of possibilities! Login now and discover the exclusive benefits awaiting you.
- Qlik Community
- :
- All Forums
- :
- QlikView App Dev
- :
- Aggr of an Aggr
- Subscribe to RSS Feed
- Mark Topic as New
- Mark Topic as Read
- Float this Topic for Current User
- Bookmark
- Subscribe
- Mute
- Printer Friendly Page
- Mark as New
- Bookmark
- Subscribe
- Mute
- Subscribe to RSS Feed
- Permalink
- Report Inappropriate Content
Aggr of an Aggr
Hi Everyone,
I don't think it can be done the way I am trying to do it (which is an aggr in an aggr), but you all have an idea for an alternative way?
So the premise is simple. I have finished goods and components (that make up the finished goods).
Let's say I have 3 finished goods:
1 - X Y Z
2 - X Y Z
3 - X Y G
Please note that finished good 1 and 2 have the same (makeup of) components. These are called a variant. So between those 3 finished goods - there are 2 variants (X Y Z and X Y G). I can't flag these variants in the script because we need to be able to select other attributes to determine what these variants are.
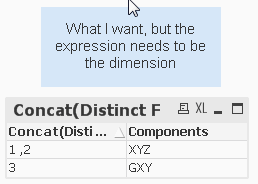
In the end, what I am trying to get is::
Dimension Expression
1, 2 X Y Z
1 X Y G
I can get it the other way around with a simple aggr function, but I need to be able to do it as a dimension (and not an expression).
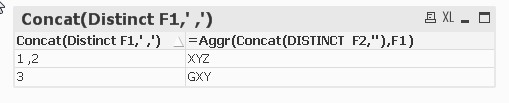
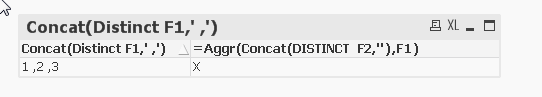
So, what I'm looking for is something like below, but it's invalid:
aggr(F1,aggr(F2,F1))
I can't group these in the script because it needs to be dynamic. It can't be an expression because the real example is more complicated with the components being listed by another dimension.
It can't be done in the script really - unless I do a complicated combination of them all.
Does anyone have any thoughts or ideas on how to solve this?
- Tags:
- aggr
- Mark as New
- Bookmark
- Subscribe
- Mute
- Subscribe to RSS Feed
- Permalink
- Report Inappropriate Content
I'm sorry - I forgot to attach an image. Attached below:
With the preferred solution I should still be able to dynamically choose components and/or finished goods and have the same concept be applied.
- Mark as New
- Bookmark
- Subscribe
- Mute
- Subscribe to RSS Feed
- Permalink
- Report Inappropriate Content
Without a clear example and data sample illustrating what you are trying to achieve (the full result, not just mucking about with the dimensions), or a substantive sample , I don't think I can help you.
I think your approach may be wrong, but your target is not clear to me, so I cannot make any useful suggestions.
- Mark as New
- Bookmark
- Subscribe
- Mute
- Subscribe to RSS Feed
- Permalink
- Report Inappropriate Content
Jonathon,
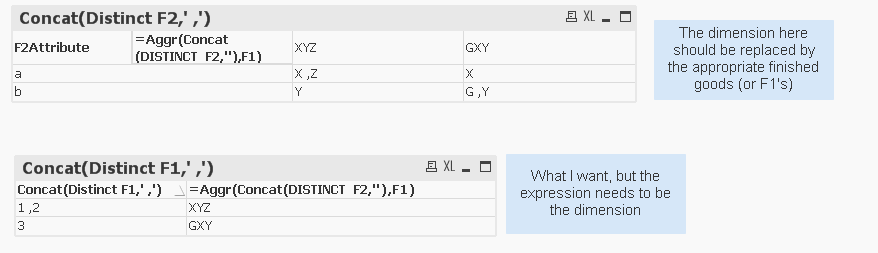
I've modified the attachment in my example to hopefully give a better reason as to why I'm trying to achieve this. Please see the added component attribute (F2Attribute). In the real example - that is actually a dimension and what I would like is for the first chart to show the groupings of F1's at the top and the components below.
Please let me know if this is helpful or if this gives you a better idea of what I am trying to achieve. Instead of achieving this with two charts (as shown in the attachment) I'd like to be able to achieve it with one chart. Does that make sense?
- Mark as New
- Bookmark
- Subscribe
- Mute
- Subscribe to RSS Feed
- Permalink
- Report Inappropriate Content
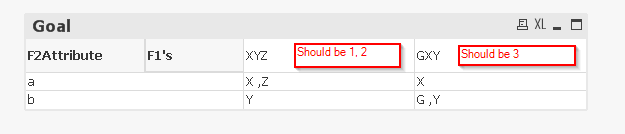
Later in the day I will try to come up with a more substantial example, but the image below is what I'd eventually like to get to. This should provide some more context as to what I would expect the chart to look like ultimately. Right now - this can only be achieved in two charts separately - I'd like it to be achieved with 1. With F1's listed at the top (as an additional dimension) and F2's at the bottom (as the expression) - unless (of course) there is a way to achieve the same result without doing it the way I'm describing.

- Mark as New
- Bookmark
- Subscribe
- Mute
- Subscribe to RSS Feed
- Permalink
- Report Inappropriate Content
If you see attached app, dimension is finished product and expression is component variant(first requirement!)
the table reacts to both product and component selections. Data loaded in different manner though.
- Mark as New
- Bookmark
- Subscribe
- Mute
- Subscribe to RSS Feed
- Permalink
- Report Inappropriate Content
I think this is an interesting solution, but I don't think it would work for a few reasons:
1. I think Component has to be in one field - otherwise we would have to select components with multiple fields - which isn't feasible for my audience. Notice that in order to get the same result in your solution you needed to choose "X" from Comp1, "Y" from Comp2 and (most importantly) "G" from Comp3 -- all that should need to be selected is Component "X". That should be what the groupings are determined by. If I select Component "X" in my example it's telling me that Finished Good 1, 2 and 3 all share the same variant - X. In your example there isn't an easy way to replicate that..
So as a recap (with having nothing selected the solution should look like this - indicating there are two variants):
With just having X selected the solution should look like this (indicating there is (based on the selections) only 1 variant - "X"):
Obviously "X" is just an example of something that can be selected - but other examples are if finished goods or components have other attributes associated to them (like for example - if I only want to chose pink components). Does that make sense?
- Mark as New
- Bookmark
- Subscribe
- Mute
- Subscribe to RSS Feed
- Permalink
- Report Inappropriate Content
would something like this work for you?
t1:
LOAD * INLINE [
F1, F2
1, X
2, X
3, X
1, Y
2, Y
3, Y
1, Z
2, Z
3, G
];
left join(t1)
LOAD F2,Concat(F1,',') as F1Concat Resident t1 Group by F2;
left join(t1)
LOAD F1,Concat(F2,',') as F2Concat Resident t1 Group by F1;
F2Attribute:
LOAD * INLINE [
F2, F2Attribute
X, a
Y, b
Z, a
G, b
];
- Mark as New
- Bookmark
- Subscribe
- Mute
- Subscribe to RSS Feed
- Permalink
- Report Inappropriate Content
It would work if everything was cleared, but it needs to be dynamic. For example you should be able to select Component "X" without problem.
Quoted from my response to Digvijay:
So as a recap - with having nothing selected the solution should look like this - (indicating there are two variants):

With just having X selected the solution should look like this (indicating there is (based on the selections) only 1 variant - "X"):

Obviously "X" is just an example of something that can be selected - but other examples are if finished goods or components have other attributes associated to them (like for example - if I only want to chose pink components). Does that make sense?
- Mark as New
- Bookmark
- Subscribe
- Mute
- Subscribe to RSS Feed
- Permalink
- Report Inappropriate Content
I am not sure why and how the concatenated would act as a dimension, or even whether it need to be a dimension (and not just an expression). Dimensions are a way of slicing data (much like a Group By in SQL) and I cannot see how you are expecting to slice the data on this concatenation.
Or perhaps you need two objects - one based on components and showing the finished goods that use the components, and one based on finished goods, showing the associated components.
- Mark as New
- Bookmark
- Subscribe
- Mute
- Subscribe to RSS Feed
- Permalink
- Report Inappropriate Content
Right now it is two objects - but I was hoping that it could be combined into 1 object. Above is just one piece to the puzzle. Did you see my other response about what my ultimate goal would be?
Right now it is as follows:
I'd like it to be combined into one object:
I'm not sure how to get the desired result without having it as a dimension (and without having two objects as I have now). I'm open to suggestions/ideas, but there is a benefit to having this be combined in one chart. I'm familiar with how dimensions work and with how Group By's work in SQL - my objective is to have a seamless integration of the two solutions (instead of having 2 charts above I'd like it to be combined to one)..
So in essence I want two group by's to be performed...The first would be performed on the concatenation based on the finished goods (to get the component variations). And the second would be performed on those component variations.
So it would look something like this (without checking syntax):
Table1:
LOAD
Finished Good
CONCAT(Component, ' ') as ConcatenatedComponent
GROUP BY
Finished Good;
FInalTable:
CONCAT(Finished Good, ' ') as DesiredDimension
GROUP BY
ConcatenatedComponent
RESIDENT
Table1;
The only difference here is that I want it all to be performed in one operation (and in Qlikview on the front end because it needs to be dynamic)....