Unlock a world of possibilities! Login now and discover the exclusive benefits awaiting you.
- Qlik Community
- :
- All Forums
- :
- QlikView App Dev
- :
- Aggregating across dimensions with multiple criter...
- Subscribe to RSS Feed
- Mark Topic as New
- Mark Topic as Read
- Float this Topic for Current User
- Bookmark
- Subscribe
- Mute
- Printer Friendly Page
- Mark as New
- Bookmark
- Subscribe
- Mute
- Subscribe to RSS Feed
- Permalink
- Report Inappropriate Content
Aggregating across dimensions with multiple criteria
Please see attached. In cells EA, EB and EC, the correct denominator is shown in red. the denominator should be the number of accounts at age= 0 but for only those vintages that are active at a given age.
- « Previous Replies
- Next Replies »
- Mark as New
- Bookmark
- Subscribe
- Mute
- Subscribe to RSS Feed
- Permalink
- Report Inappropriate Content
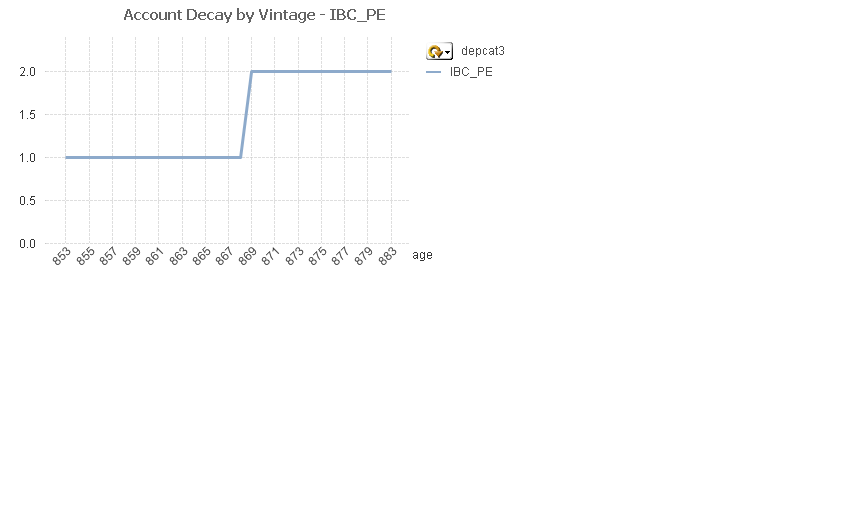
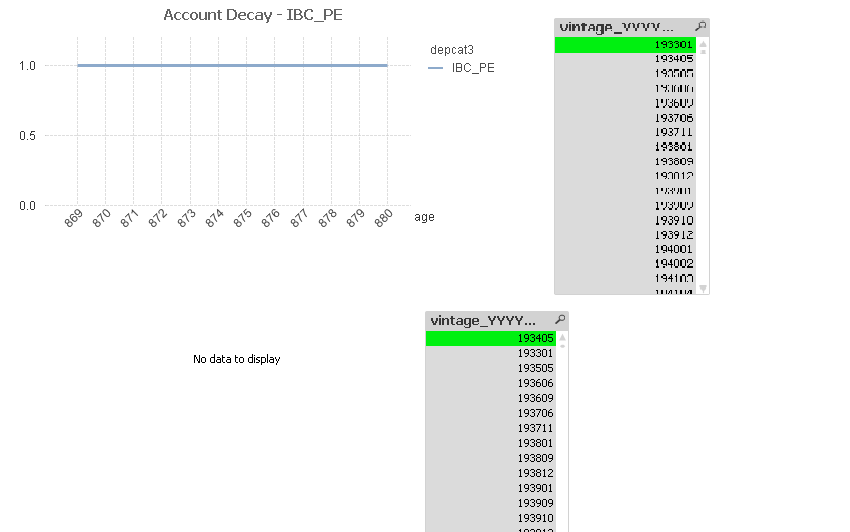
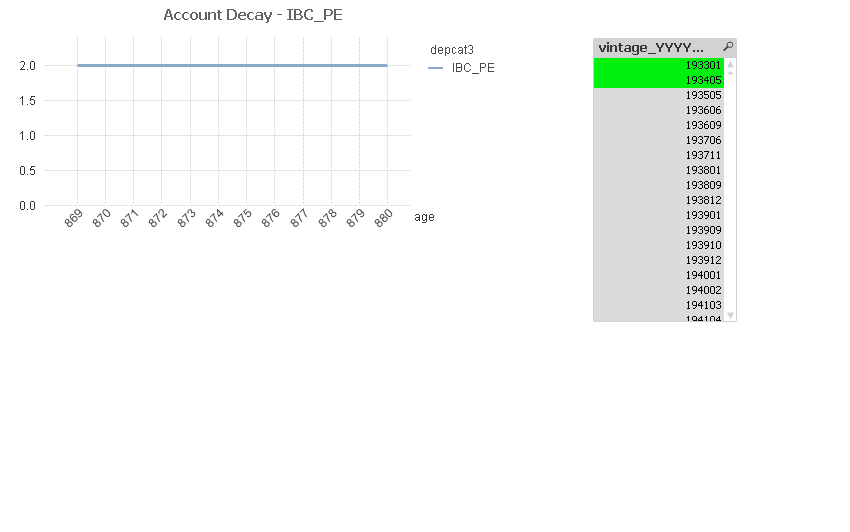
it's acting strange. I select 193301 it shows the right thing, I select 193405 it shows nothing. and then when they are select together, it is showing 2 as the percent. this shouldn't be more than. When both are selected, what it should show is the chart starting at age 853 with y-axis at 1, and then the value jumping to 2 at age 869. See first chart below.
- Mark as New
- Bookmark
- Subscribe
- Mute
- Subscribe to RSS Feed
- Permalink
- Report Inappropriate Content
1) I am seeing a straight line at 1

2) Why would the line jump to 2 at 869? When 193405 kicks into the numerator, it also kicks in into the denominator, keeping the ratio still at 1.

Is this not right?
- Mark as New
- Bookmark
- Subscribe
- Mute
- Subscribe to RSS Feed
- Permalink
- Report Inappropriate Content
I am sorry, you are right. It should stay 1. I don't know why I am seeing different output than you. The problem is I can't open your file because I don't have a server license. I copy pasted your syntax, seems to be giving different answer. Is there a way I can open your file? I am implementing your syntax is a bigger file with other dimensions, would that make a difference? What do you have in the chart's dimensions?
- Mark as New
- Bookmark
- Subscribe
- Mute
- Subscribe to RSS Feed
- Permalink
- Report Inappropriate Content
2 dimensions
1) age
2) depcat3
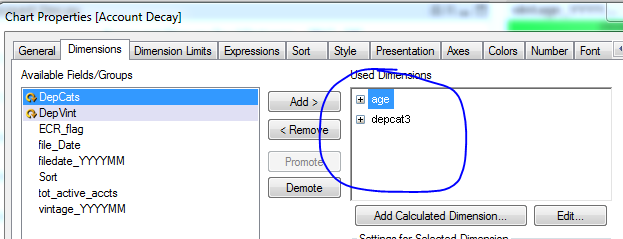
1 Expression
Sum(tot_active_accts)/Sum(Aggr(Above(Sum(tot_active_accts), Sort), (depcat3, (TEXT)), (vintage_YYYYMM, (NUMERIC)), (age, (NUMERIC))))
I hope you noted the change where I added depcat3 to the Aggr() function
- Mark as New
- Bookmark
- Subscribe
- Mute
- Subscribe to RSS Feed
- Permalink
- Report Inappropriate Content
using the exact same expression and dimensions. Not sure what is going on.
- Mark as New
- Bookmark
- Subscribe
- Mute
- Subscribe to RSS Feed
- Permalink
- Report Inappropriate Content
Can you share the file you have and I will open it and see what I see when I open your file
- Mark as New
- Bookmark
- Subscribe
- Mute
- Subscribe to RSS Feed
- Permalink
- Report Inappropriate Content
it has the bank's entire liability side  let me figure out how to mask things and will upload it. Thank you for your continued help.
- « Previous Replies
- Next Replies »