Unlock a world of possibilities! Login now and discover the exclusive benefits awaiting you.
- Qlik Community
- :
- All Forums
- :
- QlikView App Dev
- :
- Aggregation in script
- Subscribe to RSS Feed
- Mark Topic as New
- Mark Topic as Read
- Float this Topic for Current User
- Bookmark
- Subscribe
- Mute
- Printer Friendly Page
- Mark as New
- Bookmark
- Subscribe
- Mute
- Subscribe to RSS Feed
- Permalink
- Report Inappropriate Content
Aggregation in script
I have data which looks like this:
| ContractID | Customer | Contract End |
| A | John | 30/06/2016 |
| B | John | 30/01/2016 |
| C | John | 30/06/2016 |
| A | Robert | 30/06/2016 |
| B | Robert | 30/03/2016 |
| B | David | 30/06/2016 |
| C | David | 30/01/2016 |
And require to script a table that would look like this:
| Contract End | ContractID | Qtty Contracts Ending |
| 30/01/2016 | B | 1 |
| 30/01/2016 | C | 1 |
| 30/03/2016 | B | 1 |
| 30/06/2016 | A | 2 |
| 30/06/2016 | C | 1 |
| 30/06/2016 | B | 1 |
I tried using aggr(), it is easy when there is only one dimension, but I need to aggregate per Date per ContractID, and do that through script. Suggestions, please?
- Mark as New
- Bookmark
- Subscribe
- Mute
- Subscribe to RSS Feed
- Permalink
- Report Inappropriate Content
LOAD
[Contract End],
[ContractID],
Count(Customer)
RESIDENT
Data
GROUP BY
[Contract End],[ContractID];
- Mark as New
- Bookmark
- Subscribe
- Mute
- Subscribe to RSS Feed
- Permalink
- Report Inappropriate Content
Aggregation in script is done using group by statement. Try this script:
Table:
LOAD * Inline [
ContractID, Customer, Contract End
A, John, 30/06/2016
B, John, 30/01/2016
C, John, 30/06/2016
A, Robert, 30/06/2016
B, Robert, 30/03/2016
B, David, 30/06/2016
C, David, 30/01/2016
];
Join(Table)
LOAD ContractID,
[Contract End],
Count(Customer) as [Qtty Contracts Ending]
Resident Table
Group By ContractID, [Contract End];
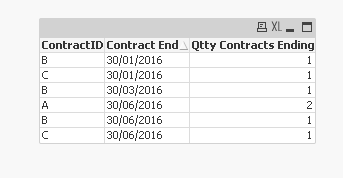
Output:
- Mark as New
- Bookmark
- Subscribe
- Mute
- Subscribe to RSS Feed
- Permalink
- Report Inappropriate Content
LOAD
[Contract End],
[ContractID],
Count(Customer)
FROM
Data.XLS (ooxml....)
GROUP BY
[Contract End],[ContractID];