Unlock a world of possibilities! Login now and discover the exclusive benefits awaiting you.
- Qlik Community
- :
- All Forums
- :
- QlikView App Dev
- :
- Amount of hours by month with >350
- Subscribe to RSS Feed
- Mark Topic as New
- Mark Topic as Read
- Float this Topic for Current User
- Bookmark
- Subscribe
- Mute
- Printer Friendly Page
- Mark as New
- Bookmark
- Subscribe
- Mute
- Subscribe to RSS Feed
- Permalink
- Report Inappropriate Content
Amount of hours by month with >350
Hi Expert
I have distribuate hours and tickets for parking, as you see in the screen , i have select one MONTH, and one DAY and i see the amount of tickets for this day, this month.
if the amount of tickets is >350, i paint it black
But i want to calculate and see in a char , the number of hours that i have more than 350 in the whole MONTH, not only in the day
for example:
in october , i have only one with more than >350, i wan to see a bar chart, that show Octobre with only 1 item
but if in november i have 5 hours wiht more than 350, i want to see teh bar chart with november and 5 items count
attached a qvw with example and image to show
thank you a lot expert
Fernando K.
Accepted Solutions
- Mark as New
- Bookmark
- Subscribe
- Mute
- Subscribe to RSS Feed
- Permalink
- Report Inappropriate Content
Hi, Fernando
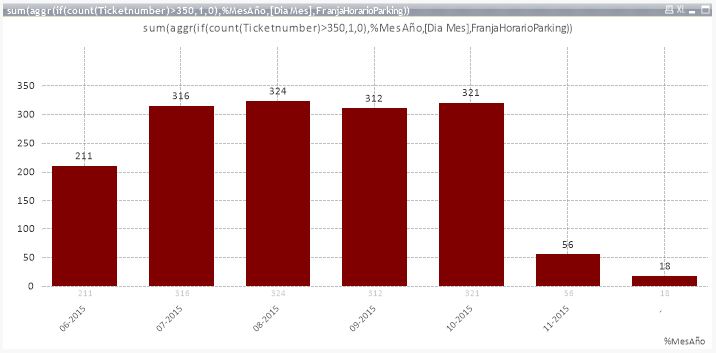
If you create a bar chart with %MesAño as the Dimension and
=sum(aggr(if(count(Ticketnumber)>350,1,0),%MesAño,[Dia Mes],FranjaHorarioParking))
as the expression, I thik you'll have what you need
Eduardo
- Mark as New
- Bookmark
- Subscribe
- Mute
- Subscribe to RSS Feed
- Permalink
- Report Inappropriate Content
Maybe a calculated dimension - in chart or listbox - like:
aggr(class(count(Hour), 100 /* or more flexible with a variable like $(vHourCluster) */), Hour)
is a useful approach or a set analysis filter like:
count({< Hour = {"=count(Hour) > 350"} >} Hour)
- Marcus
- Mark as New
- Bookmark
- Subscribe
- Mute
- Subscribe to RSS Feed
- Permalink
- Report Inappropriate Content
Hi, Fernando
If you create a bar chart with %MesAño as the Dimension and
=sum(aggr(if(count(Ticketnumber)>350,1,0),%MesAño,[Dia Mes],FranjaHorarioParking))
as the expression, I thik you'll have what you need
Eduardo