Unlock a world of possibilities! Login now and discover the exclusive benefits awaiting you.
- Qlik Community
- :
- All Forums
- :
- QlikView App Dev
- :
- Animated Bubble Chart
- Subscribe to RSS Feed
- Mark Topic as New
- Mark Topic as Read
- Float this Topic for Current User
- Bookmark
- Subscribe
- Mute
- Printer Friendly Page
- Mark as New
- Bookmark
- Subscribe
- Mute
- Subscribe to RSS Feed
- Permalink
- Report Inappropriate Content
Animated Bubble Chart
I have a table like following.
| Engine | Year | Temperature 1 | Temperature 2 |
|---|---|---|---|
| A | 2011 | -6 | 13 |
| A | 2012 | -7 | 25 |
| B | 2011 | -3 | 8 |
| B | 2012 | -2 | 12 |
I am trying to make a bubble chart which would show the values of Temperature1 and Temperature2 separately on Y-axis. Bubble's color will represent Engine and bubbles wil animate in Y direction with the change in value of Temperatures with change in Year. So Year is the dimension that controls the animation and value of Temperatures are the ones which animate showing results for each Engine.
The problem here is what should I represent on X-axis? I want it like the picture attached here, so that behavior of both Temperatures can be visualized combined in one chart, but separated by a distance on X-axis.
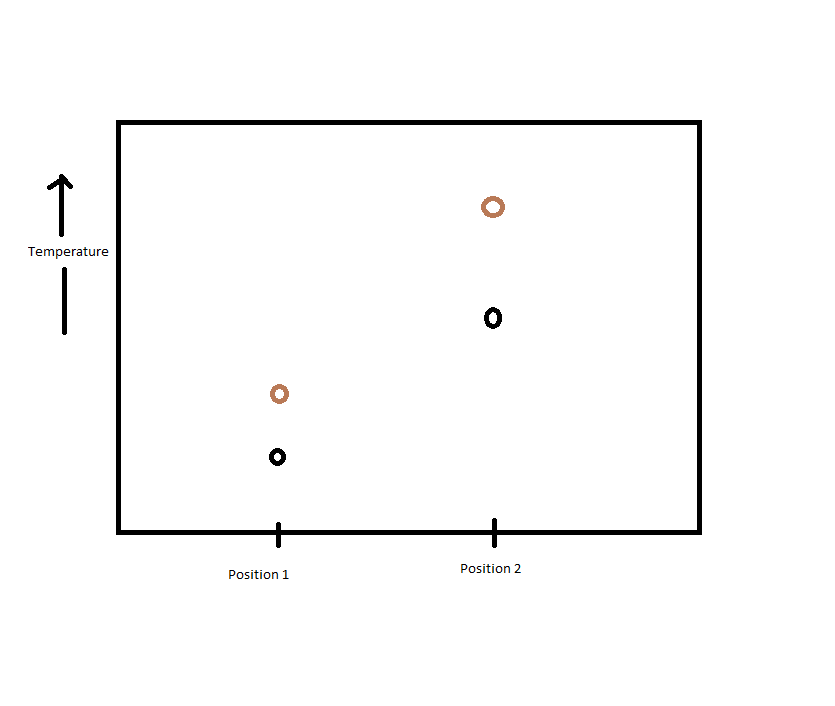
Position 1 corresponds to Temperature1 and Position 2 corresponds to Temperature2. On Y-axis, are the values of both the temperatures animating with change in Year
- Mark as New
- Bookmark
- Subscribe
- Mute
- Subscribe to RSS Feed
- Permalink
- Report Inappropriate Content
Go through http://www.qlikblog.at/2574/qlikview-extension-animated-scatter-chart/
and
http://community.qlik.com/blogs/qlikviewdesignblog/2013/03/18/scatter-chart
post.
Vikas
If the issue is solved please mark the answer with Accept as Solution & like it.
If you want to go quickly, go alone. If you want to go far, go together.
- Mark as New
- Bookmark
- Subscribe
- Mute
- Subscribe to RSS Feed
- Permalink
- Report Inappropriate Content
pfa sample
Vikas
If the issue is solved please mark the answer with Accept as Solution & like it.
If you want to go quickly, go alone. If you want to go far, go together.
- Mark as New
- Bookmark
- Subscribe
- Mute
- Subscribe to RSS Feed
- Permalink
- Report Inappropriate Content
Hi,
Check this
http://community.qlik.com/message/595570#595570
http://community.qlik.com/docs/DOC-3935
Regards
ASHFAQ
- Mark as New
- Bookmark
- Subscribe
- Mute
- Subscribe to RSS Feed
- Permalink
- Report Inappropriate Content
Hi Vikas
The sample you've attached has a well defined dimension for X-axis (per capita GDP). My problem is that I don't have such a dmension available in table. As can be seen in the picture, values of Temperature1 should lie on Position1 which is currently not available. I tried to make a new table which as mapping for Positions and kind of Temperature (Temperature1 or Temperature2). But the problem is how to combine this table with the earlier one to give Position as X-axis parameter.