Unlock a world of possibilities! Login now and discover the exclusive benefits awaiting you.
- Qlik Community
- :
- All Forums
- :
- QlikView App Dev
- :
- Re: Average Age Calculation in Text Box
- Subscribe to RSS Feed
- Mark Topic as New
- Mark Topic as Read
- Float this Topic for Current User
- Bookmark
- Subscribe
- Mute
- Printer Friendly Page
- Mark as New
- Bookmark
- Subscribe
- Mute
- Subscribe to RSS Feed
- Permalink
- Report Inappropriate Content
Average Age Calculation in Text Box
I am trying to calculate the average age of 'open' and "on-hold" records in a data set (see attached spreadsheet) and display in a text box.
The expression I am using is this:
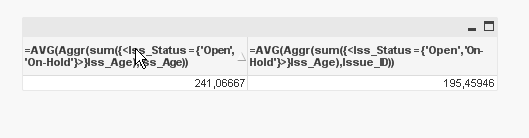
=AVG(Aggr(sum({<Iss_Status = {'Open', 'On-Hold'}>}Iss_Age),Iss_Age))
The result I am getting s 239.83333 and it should be 195 (per the spreadsheet).
What am I doing wrong in the formula?
Thanks.
Jeff
Accepted Solutions
- Mark as New
- Bookmark
- Subscribe
- Mute
- Subscribe to RSS Feed
- Permalink
- Report Inappropriate Content
Try
=AVG({<Iss_Status = {'Open', 'On-Hold'}>} Aggr(sum({<Iss_Status = {'Open', 'On-Hold'}>}Iss_Age),Iss_Age))
edit:
No, this should be correct:
=AVG(Aggr(sum({<Iss_Status = {'Open', 'On-Hold'}>}Iss_Age),Issue_ID))
- Mark as New
- Bookmark
- Subscribe
- Mute
- Subscribe to RSS Feed
- Permalink
- Report Inappropriate Content
display the aggregate total of the number of days as well as the number of rows in the qlikView application - that will tell you how it is cvalculating
- Mark as New
- Bookmark
- Subscribe
- Mute
- Subscribe to RSS Feed
- Permalink
- Report Inappropriate Content
Just do: =Avg({<Iss_Status = {'Open', 'On-Hold'}>}Iss_Age)
- Mark as New
- Bookmark
- Subscribe
- Mute
- Subscribe to RSS Feed
- Permalink
- Report Inappropriate Content
Excell is aggregating a value of 7232 and dividing by 37 (the number of open and on-hold)
verifying in Qlik will tell you how Qlik is coming up with average
- Mark as New
- Bookmark
- Subscribe
- Mute
- Subscribe to RSS Feed
- Permalink
- Report Inappropriate Content
I also do not believe you need to do an Aggr if you are using the average function - you would only need the aggr function for example if you were going to calcualte the average yoursel you would aggregate and then divide the aggregate by the number of entries
The avg function does that for you
- Mark as New
- Bookmark
- Subscribe
- Mute
- Subscribe to RSS Feed
- Permalink
- Report Inappropriate Content
=AVG(Aggr(sum({<Iss_Status = {'Open', 'On-Hold'}>}Iss_Age),Issue_ID))
- Mark as New
- Bookmark
- Subscribe
- Mute
- Subscribe to RSS Feed
- Permalink
- Report Inappropriate Content
Try one of the two options.