Unlock a world of possibilities! Login now and discover the exclusive benefits awaiting you.
- Qlik Community
- :
- All Forums
- :
- QlikView App Dev
- :
- Average from count if text matches and (of course)...
- Subscribe to RSS Feed
- Mark Topic as New
- Mark Topic as Read
- Float this Topic for Current User
- Bookmark
- Subscribe
- Mute
- Printer Friendly Page
- Mark as New
- Bookmark
- Subscribe
- Mute
- Subscribe to RSS Feed
- Permalink
- Report Inappropriate Content
Average from count if text matches and (of course) aggr
Hi everyone,
I want to create a comparison bar chart showing the average of adults and children by group size. Example:
Group 1,3 and 5 have 3 persons. So The avg adults is 2 ((2 +1+3) / 3) and children average is 3 ((1+2+0) /3). I want this calculation by group count: i.e. 2 persons grouop, 3 persons group..
So far I created a dimension: =aggr(count(distinct id), group) to group by "group" which works.
For the formulas I was trying with : count(if( SubStringCount( type, 'Adult') , 1 , 0) ) and count(if( SubStringCount( type, 'Child') , 1 , 0) ) but I am getting the total sum of the count (no longer by aggr).
I think I need an avg instead of count? I appreciate any suggestions.
| id | group | type |
|---|---|---|
| 1 | 1 | Adult_2 |
| 2 | 1 | Adult_1 |
| 3 | 1 | Child_2 |
| 4 | 2 | Adult_1 |
| 5 | 2 | Adult_1 |
| 6 | 3 | Adult_1 |
| 7 | 3 | Child_1 |
| 8 | 3 | Child_1 |
| 9 | 4 | Adult_1 |
| 10 | 4 | Child_1 |
| 11 | 5 | Adult_2 |
| 12 | 5 | Adult_1 |
| 13 | 5 | Adult_1 |
Accepted Solutions
- Mark as New
- Bookmark
- Subscribe
- Mute
- Subscribe to RSS Feed
- Permalink
- Report Inappropriate Content
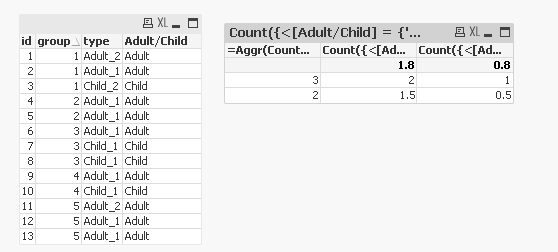
May be this
Count({<[Adult/Child] = {'Adult'}>}id)/Count(DISTINCT group)
Count({<[Adult/Child] = {'Child'}>}id)/Count(DISTINCT group)
Where [Adult/Child] is created in the script like this
Table:
LOAD *,
SubField(type, '_', 1) as [Adult/Child];
LOAD * INLINE [
id, group, type
1, 1, Adult_2
2, 1, Adult_1
3, 1, Child_2
4, 2, Adult_1
5, 2, Adult_1
6, 3, Adult_1
7, 3, Child_1
8, 3, Child_1
9, 4, Adult_1
10, 4, Child_1
11, 5, Adult_2
12, 5, Adult_1
13, 5, Adult_1
];
- Mark as New
- Bookmark
- Subscribe
- Mute
- Subscribe to RSS Feed
- Permalink
- Report Inappropriate Content
May be this
Count({<[Adult/Child] = {'Adult'}>}id)/Count(DISTINCT group)
Count({<[Adult/Child] = {'Child'}>}id)/Count(DISTINCT group)
Where [Adult/Child] is created in the script like this
Table:
LOAD *,
SubField(type, '_', 1) as [Adult/Child];
LOAD * INLINE [
id, group, type
1, 1, Adult_2
2, 1, Adult_1
3, 1, Child_2
4, 2, Adult_1
5, 2, Adult_1
6, 3, Adult_1
7, 3, Child_1
8, 3, Child_1
9, 4, Adult_1
10, 4, Child_1
11, 5, Adult_2
12, 5, Adult_1
13, 5, Adult_1
];