Unlock a world of possibilities! Login now and discover the exclusive benefits awaiting you.
Announcements
Save $650 on Qlik Connect, Dec 1 - 7, our lowest price of the year. Register with code CYBERWEEK: Register
- Qlik Community
- :
- All Forums
- :
- QlikView App Dev
- :
- Average of all preceding values
Options
- Subscribe to RSS Feed
- Mark Topic as New
- Mark Topic as Read
- Float this Topic for Current User
- Bookmark
- Subscribe
- Mute
- Printer Friendly Page
Turn on suggestions
Auto-suggest helps you quickly narrow down your search results by suggesting possible matches as you type.
Showing results for
Not applicable
2012-11-27
08:01 AM
- Mark as New
- Bookmark
- Subscribe
- Mute
- Subscribe to RSS Feed
- Permalink
- Report Inappropriate Content
Average of all preceding values
Hey!!
I would like to plot the following expression:
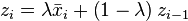 .
.
For that I need the average of all preceding values. My dimension is a column with dates (days).
I tried: lambda*avg(L_Z1V1)+(1-lambda)*avg({1-$}L_Z1V1)
But it didn't work.
Thank you very much!!!
Eduardo
1,371 Views
- « Previous Replies
-
- 1
- 2
- Next Replies »
11 Replies
Master II
2012-11-28
08:07 AM
- Mark as New
- Bookmark
- Subscribe
- Mute
- Subscribe to RSS Feed
- Permalink
- Report Inappropriate Content
=rangeavg(above(Avg(Value), 0, rowno()))
Not applicable
2012-11-28
08:45 AM
Author
- Mark as New
- Bookmark
- Subscribe
- Mute
- Subscribe to RSS Feed
- Permalink
- Report Inappropriate Content
Sorry but it still doesn't do what I need...
Thank you for your effort. I appreciate your persistance.
Eduardo
130 Views
- « Previous Replies
-
- 1
- 2
- Next Replies »