Unlock a world of possibilities! Login now and discover the exclusive benefits awaiting you.
- Qlik Community
- :
- All Forums
- :
- QlikView App Dev
- :
- Avg()
- Subscribe to RSS Feed
- Mark Topic as New
- Mark Topic as Read
- Float this Topic for Current User
- Bookmark
- Subscribe
- Mute
- Printer Friendly Page
- Mark as New
- Bookmark
- Subscribe
- Mute
- Subscribe to RSS Feed
- Permalink
- Report Inappropriate Content
Avg()
Hi Experts,
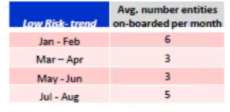
Can any one please help me on Creating a below Table with Avg Number of entities per Month with the below format.
Please find the below sample data from the source in inline script.
Load * inline [
Risk,Month, Entities
Low,Jan,5
Low,Feb,7
Low,Mar,2
Low,Apr,4
Low,May,3
Low,Jun,3
Low,Jul,5
Low,Aug,5
Low,Sep,0
]
In the Table first column need to show like
Jan-Feb, Mar-Apr, May-Jun,Jul-Aug
The calculation is like below Jan+ Feb= 5+7 =12/2=6
Mar+Apr = 2+4 =6/2 =3
May+Jun= 3+3=6/2=3
Jul + Aug=5+5=10/2=5
There is no Oct for adding with Sep so not showing in table.
Thanks in advance.
Accepted Solutions
- Mark as New
- Bookmark
- Subscribe
- Mute
- Subscribe to RSS Feed
- Permalink
- Report Inappropriate Content
Using MonthOrder :
Load * inline [
Risk,Month, Entities,MonthOrder
Low,Jan,5,1
Low,Feb,7,2
Low,Mar,2,3
Low,Apr,4,4
Low,May,3,5
Low,Jun,3,6
Low,Jul,5,7
Low,Aug,5,8
Low,Sep,0,9
];
Now take a straight table and add dimension :
=Aggr(If(Odd(MonthOrder),Month &'-' & Below(Month)),Month)
Now Add the Expression:
=Aggr(If(Odd(RowNo()),(Sum(Entities)+Below(Sum(Entities)))/2),Month)
- Mark as New
- Bookmark
- Subscribe
- Mute
- Subscribe to RSS Feed
- Permalink
- Report Inappropriate Content
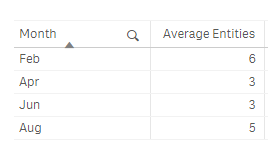
Hi,
try this as an expression on a table:
=Only({<Month={'Feb','Apr','Jun','Aug'}>} aggr(RangeAvg(Above(Entities,0,2)),Month))
- Mark as New
- Bookmark
- Subscribe
- Mute
- Subscribe to RSS Feed
- Permalink
- Report Inappropriate Content
Hi Bhavani, you can add a field with the grouped months:
Left Join (InlineTableName)
LOAD * Inline [
Month, GroupedMonthName
Jan, Jan - Feb
Feb, Jan - Feb
Mar, Mar - Apr
Apr, Mar - Apr
....
];
Using GroupedMonthName and an expression like "Avg(Entities)" it should work
- Mark as New
- Bookmark
- Subscribe
- Mute
- Subscribe to RSS Feed
- Permalink
- Report Inappropriate Content
Using MonthOrder :
Load * inline [
Risk,Month, Entities,MonthOrder
Low,Jan,5,1
Low,Feb,7,2
Low,Mar,2,3
Low,Apr,4,4
Low,May,3,5
Low,Jun,3,6
Low,Jul,5,7
Low,Aug,5,8
Low,Sep,0,9
];
Now take a straight table and add dimension :
=Aggr(If(Odd(MonthOrder),Month &'-' & Below(Month)),Month)
Now Add the Expression:
=Aggr(If(Odd(RowNo()),(Sum(Entities)+Below(Sum(Entities)))/2),Month)
- Mark as New
- Bookmark
- Subscribe
- Mute
- Subscribe to RSS Feed
- Permalink
- Report Inappropriate Content
Hi Youssef,
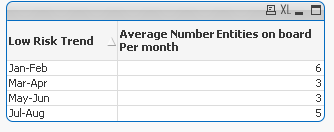
Thanks for your reply. Getting the result like below. But business want to see the Month Column as Jan-Feb, Mar-Apr, May-Jun, Jul-Aug. is this possible to show the dimension like this in Front end without any changes in the backend.
Thanks in advance.
- Mark as New
- Bookmark
- Subscribe
- Mute
- Subscribe to RSS Feed
- Permalink
- Report Inappropriate Content
Yes you can do this by using a calculated dimension
=if(Match(Month,'Jan','Feb'),'Jan-Feb',
if(Match(Month,'Mar','Apr'),'Mar-Apr',
if(Match(Month,'May','Jun'),'May-Jun',
if(Match(Month,'Jul','Aug'),'Jul-Aug', Month))))
PFA