Unlock a world of possibilities! Login now and discover the exclusive benefits awaiting you.
- Qlik Community
- :
- All Forums
- :
- QlikView App Dev
- :
- Backlog Calculation for Bar Chart
- Subscribe to RSS Feed
- Mark Topic as New
- Mark Topic as Read
- Float this Topic for Current User
- Bookmark
- Subscribe
- Mute
- Printer Friendly Page
- Mark as New
- Bookmark
- Subscribe
- Mute
- Subscribe to RSS Feed
- Permalink
- Report Inappropriate Content
Backlog Calculation for Bar Chart
Hi All,
I need your help, I have attached an excel file where I am having data as below,
| Month | # Opened Request | # Closed Request | Backlog | Backlog Calculation |
| Jan | 48 | 35 | 13 | 13 |
| Feb | 116 | 102 | 27 | 13+14 |
| Mar | 23 | 33 | 17 | -10+27 |
| Apr | 65 | 26 | 56 | 39+17 |
| May | 50 | 21 | 85 | 29+56 |
| Jun | 21 | 35 | 71 | -14+85 |
| Jul | 78 | 30 | 119 | 48+71 |
| Aug | 35 | 42 | 112 | -7+119 |
| Sep | 120 | 96 | 136 | 24+112 |
| Oct | 45 | 52 | 129 | -7+136 |
| Nov | 60 | 92 | 97 | -32+129 |
| Dec | 75 | 70 | 102 | 5+97 |
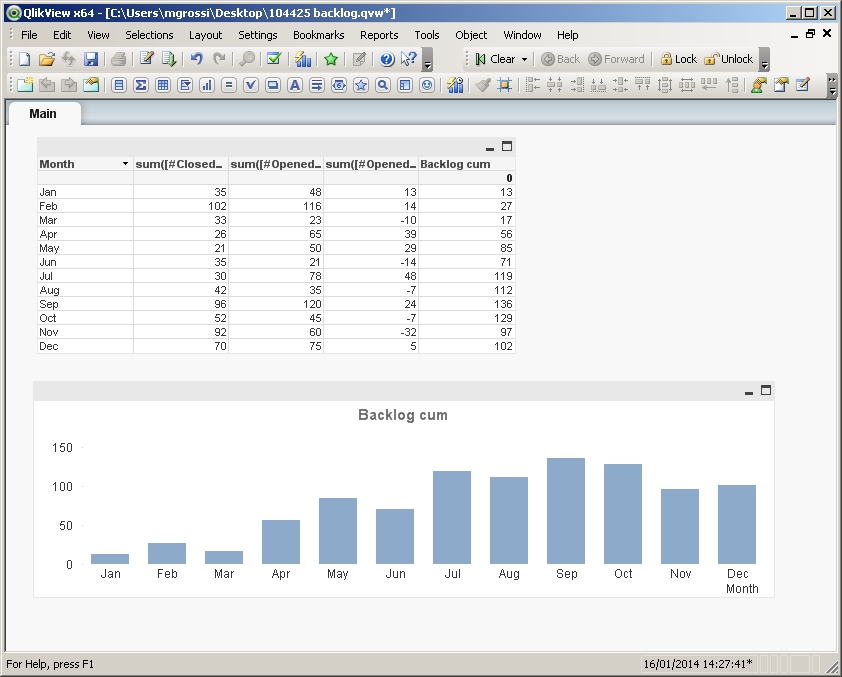
I want to show this data in Bar Chart, but here is one problem. The data I provided is the expected output (using exprtession). I could able to write the expression for "# Opened Request" and "# Closed Request" but I am not able to write expression for BACKLOG column. Backlog is nothing but the reminder or Opened - Closed and addition of previous result to it (I did provided calculation of Backlog for your understanding).
The expressions I used for "# Opened Request" and "# Closed Request" are as below,
"# Opened Request" : sum (Open_Ticket_Count)
"# Closed Request" : sum (Closed_ticket_count)
Can anyone please help me with how can I write expression for "Backlog"?
Thanks in advance.
Regards,
Abhishek
Accepted Solutions
- Mark as New
- Bookmark
- Subscribe
- Mute
- Subscribe to RSS Feed
- Permalink
- Report Inappropriate Content
Hi
try this expression
=rangesum(Above(sum([# Opened Request]) - sum([# Closed Request]), 0, RowNo()))
if it's what you want I can post the .qvw
Regards
- Mark as New
- Bookmark
- Subscribe
- Mute
- Subscribe to RSS Feed
- Permalink
- Report Inappropriate Content
Hi
try this expression
=rangesum(Above(sum([# Opened Request]) - sum([# Closed Request]), 0, RowNo()))
if it's what you want I can post the .qvw
Regards
- Mark as New
- Bookmark
- Subscribe
- Mute
- Subscribe to RSS Feed
- Permalink
- Report Inappropriate Content
Dear Abhishek,
PFA for a Solution...
Regards
Kiran Rode
+91 8976977897
- Mark as New
- Bookmark
- Subscribe
- Mute
- Subscribe to RSS Feed
- Permalink
- Report Inappropriate Content
Thank you guys, it worked well 🙂
- Mark as New
- Bookmark
- Subscribe
- Mute
- Subscribe to RSS Feed
- Permalink
- Report Inappropriate Content
Thanks Kiran
- Mark as New
- Bookmark
- Subscribe
- Mute
- Subscribe to RSS Feed
- Permalink
- Report Inappropriate Content
Thanks Massimo Grossi 🙂