Unlock a world of possibilities! Login now and discover the exclusive benefits awaiting you.
- Qlik Community
- :
- All Forums
- :
- QlikView App Dev
- :
- Bar Chart - Value - "Text on Axis" displayed as d...
- Subscribe to RSS Feed
- Mark Topic as New
- Mark Topic as Read
- Float this Topic for Current User
- Bookmark
- Subscribe
- Mute
- Printer Friendly Page
- Mark as New
- Bookmark
- Subscribe
- Mute
- Subscribe to RSS Feed
- Permalink
- Report Inappropriate Content
Bar Chart - Value - "Text on Axis" displayed as doubled
Hi
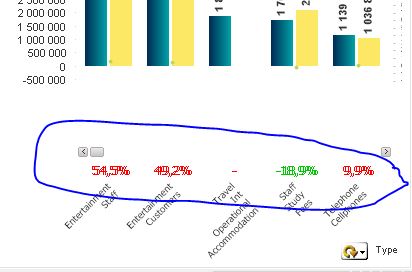
I have a bar chart, with 3 expressions. The first 2 are bars where the third, its just "Text on Axis". The 3rd expression, the value displayed is double. See screenshot below. How do I fix this?
Kind regards
Nayan
- « Previous Replies
-
- 1
- 2
- Next Replies »
- Mark as New
- Bookmark
- Subscribe
- Mute
- Subscribe to RSS Feed
- Permalink
- Report Inappropriate Content
Can you share your expressions?
- Mark as New
- Bookmark
- Subscribe
- Mute
- Subscribe to RSS Feed
- Permalink
- Report Inappropriate Content
Hi Shashank
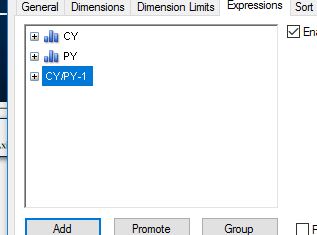
Its a percentage variance between the first 2 expressions. CY/PY -1.
CY =$(viExpense_Category(vYTD))
PY = =$(viExpense_Category(vPYTD))
Kind regards
Nayan
- Mark as New
- Bookmark
- Subscribe
- Mute
- Subscribe to RSS Feed
- Permalink
- Report Inappropriate Content
I think it is something to check with your font settings
- Mark as New
- Bookmark
- Subscribe
- Mute
- Subscribe to RSS Feed
- Permalink
- Report Inappropriate Content
If i see for Telephone Cellphones Dimension:
CY=~1139 & PY=~1036
CY/PY=(1139/1036)-1 = 9.9%
Which is correct? So, i am not able to understand how it is double.
Can you please specify the scenario?
- Mark as New
- Bookmark
- Subscribe
- Mute
- Subscribe to RSS Feed
- Permalink
- Report Inappropriate Content
Ok... Sorry i misunderstood the thing. I got it now... That it is hsowing two times not Double Value  .
.
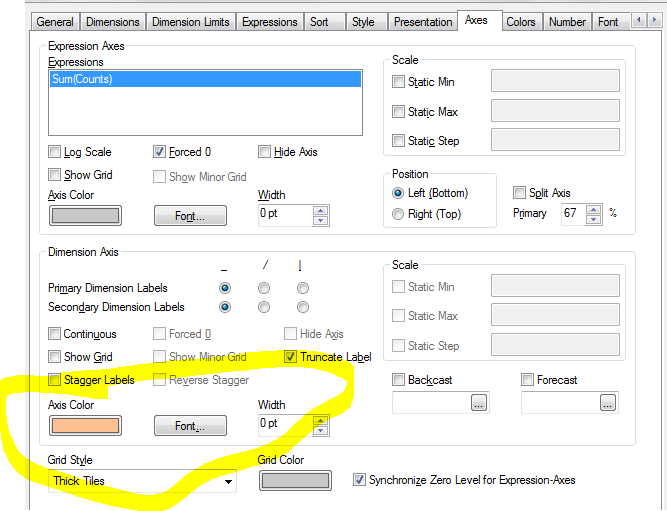
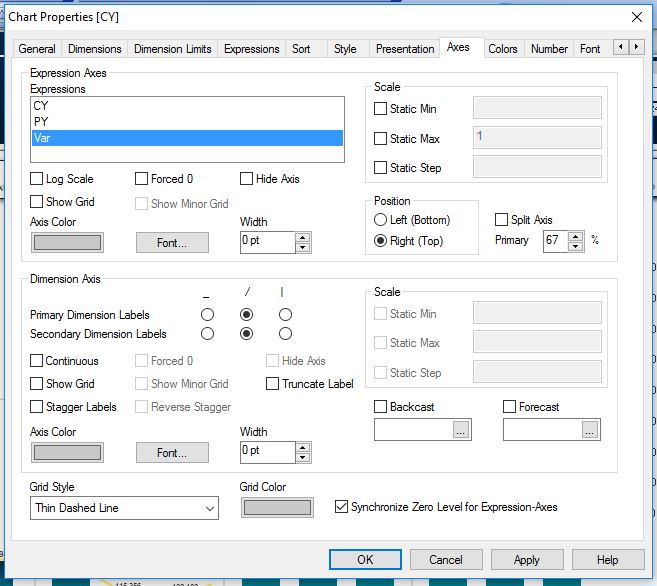
Can you please share screenshot of your Expression and Axes tab ?
- Mark as New
- Bookmark
- Subscribe
- Mute
- Subscribe to RSS Feed
- Permalink
- Report Inappropriate Content
Hi Shasshank
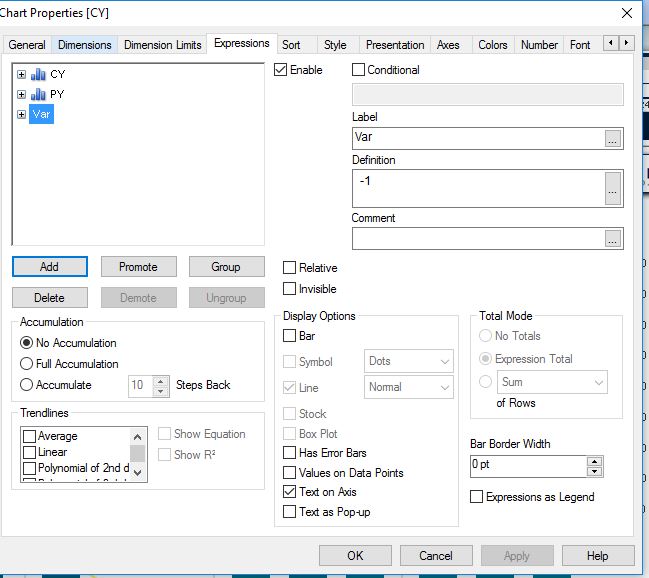
In my Dimension i have a Group, which rotates between Employee and Type. When I switch to Type, the values don't appear double, however when i switch to employee it doubles. Below are screenshots of the expression and axis tabs.
Kind regards
Nayan
- Mark as New
- Bookmark
- Subscribe
- Mute
- Subscribe to RSS Feed
- Permalink
- Report Inappropriate Content
Hi Varun
I've change the font, but still shows double.
Kind regards
Nayan
- Mark as New
- Bookmark
- Subscribe
- Mute
- Subscribe to RSS Feed
- Permalink
- Report Inappropriate Content
Share a sample qvw file with dummy data.
- Mark as New
- Bookmark
- Subscribe
- Mute
- Subscribe to RSS Feed
- Permalink
- Report Inappropriate Content
Hi Varun
Its complicated, but will see what I can do. Thank you.
Kind regards
Nayan
- « Previous Replies
-
- 1
- 2
- Next Replies »