Unlock a world of possibilities! Login now and discover the exclusive benefits awaiting you.
- Qlik Community
- :
- All Forums
- :
- QlikView App Dev
- :
- Bar Graph Display Issue when using LOG SCALE axis
- Subscribe to RSS Feed
- Mark Topic as New
- Mark Topic as Read
- Float this Topic for Current User
- Bookmark
- Subscribe
- Mute
- Printer Friendly Page
- Mark as New
- Bookmark
- Subscribe
- Mute
- Subscribe to RSS Feed
- Permalink
- Report Inappropriate Content
Bar Graph Display Issue when using LOG SCALE axis
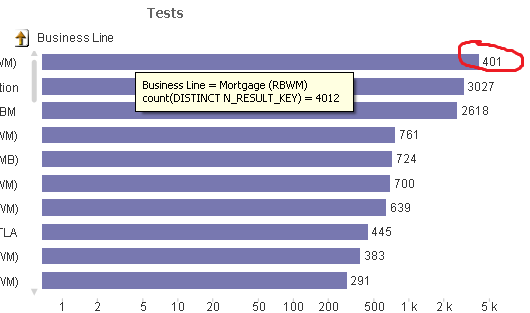
In the above chart, note that the number at the end of the top bar has been truncated.
This goes away if I make the chart much wider and gets worse as I make it narrower.
As you can see in the pop-up it should be 4012.
I have worked around this elsewhere by setting a "Static Max" in the Axes tab of the Properties of the chart.
10,000 might work in this instance.
In this case becasue it is a drill down, my log scale changes as I drill down.
So I got the idea to use an expression for the "Static Max" such as
=Count(DISTINCT N_RESULT_KEY) Which would be the numnber represented by the total of all bars.
This works most of the time but not always.
My question is: Has anyone else run into this and how did they solve it?
I'm thinking finding the value of the first bar and multiplying it by 1.5 or 2, something like this:
=FirstSortedValue(Count(DISTINCT N_RESULT_KEY),Count(DISTINCT N_RESULT_KEY))*2
Theproblem is I don't quite understands how FirstSortedValue should be used in this case, it isn't working.
Any ideas?
- Mark as New
- Bookmark
- Subscribe
- Mute
- Subscribe to RSS Feed
- Permalink
- Report Inappropriate Content
Don't display the values on top of the bars, but use Text on Axis so that the values are shown in front of the bars. You'll probably need to resize the plot area a bit so these values don't overlap with the bar labels.Press the CTRL+SHIFT keys at the same time and you'll see red outlines around the chart elements. You can resize/move those red outlines.
talk is cheap, supply exceeds demand
- Mark as New
- Bookmark
- Subscribe
- Mute
- Subscribe to RSS Feed
- Permalink
- Report Inappropriate Content
Rather than FirstSortedValue, I suggest Max(Aggr()) like this:
=Max(Aggr(Count(DISTINCT N_RESULT_KEY), [Business Line]))
(assuming Business Line is the dimension).
Have you tried displaying the value on the x-axis instead of on the bars?
- Mark as New
- Bookmark
- Subscribe
- Mute
- Subscribe to RSS Feed
- Permalink
- Report Inappropriate Content
That would work, but sometimes I don;t want the numbers on the axis.
Are we saying there is no solution?
- Mark as New
- Bookmark
- Subscribe
- Mute
- Subscribe to RSS Feed
- Permalink
- Report Inappropriate Content
There are always solutions. The question is if you're willing to pay the price  .
.
You can try what jontydkpi suggests. Except I would add a bit to it. Perhaps multiple the result by 2 since you're using a log scale. That gives you a bit more space for the text of the value.
talk is cheap, supply exceeds demand
- Mark as New
- Bookmark
- Subscribe
- Mute
- Subscribe to RSS Feed
- Permalink
- Report Inappropriate Content
=Max(Aggr(Count(DISTINCT N_RESULT_KEY), GetCurrentField(LOB_CNTRLO_ApplGrp))) * 2
So, since I am in a Group, I added the GetCurrentField bit but this did not work... any ideas?
- Mark as New
- Bookmark
- Subscribe
- Mute
- Subscribe to RSS Feed
- Permalink
- Report Inappropriate Content
If I went with numbers on axis, I can't for the life of me find where I can change the font color on them ...
- Mark as New
- Bookmark
- Subscribe
- Mute
- Subscribe to RSS Feed
- Permalink
- Report Inappropriate Content
Never mind, I found it... under Text Color of expression in Expressions tab