Unlock a world of possibilities! Login now and discover the exclusive benefits awaiting you.
- Qlik Community
- :
- All Forums
- :
- QlikView App Dev
- :
- Bar Graph with transparency
- Subscribe to RSS Feed
- Mark Topic as New
- Mark Topic as Read
- Float this Topic for Current User
- Bookmark
- Subscribe
- Mute
- Printer Friendly Page
- Mark as New
- Bookmark
- Subscribe
- Mute
- Subscribe to RSS Feed
- Permalink
- Report Inappropriate Content
Bar Graph with transparency
Can anybody help me with bar graph with Sales to Objectives as in attached pic? Can not find answer in existing topics...
Thanks, in advance for help.
V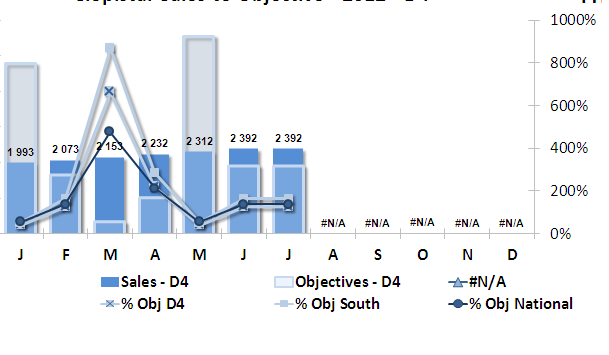
- Mark as New
- Bookmark
- Subscribe
- Mute
- Subscribe to RSS Feed
- Permalink
- Report Inappropriate Content
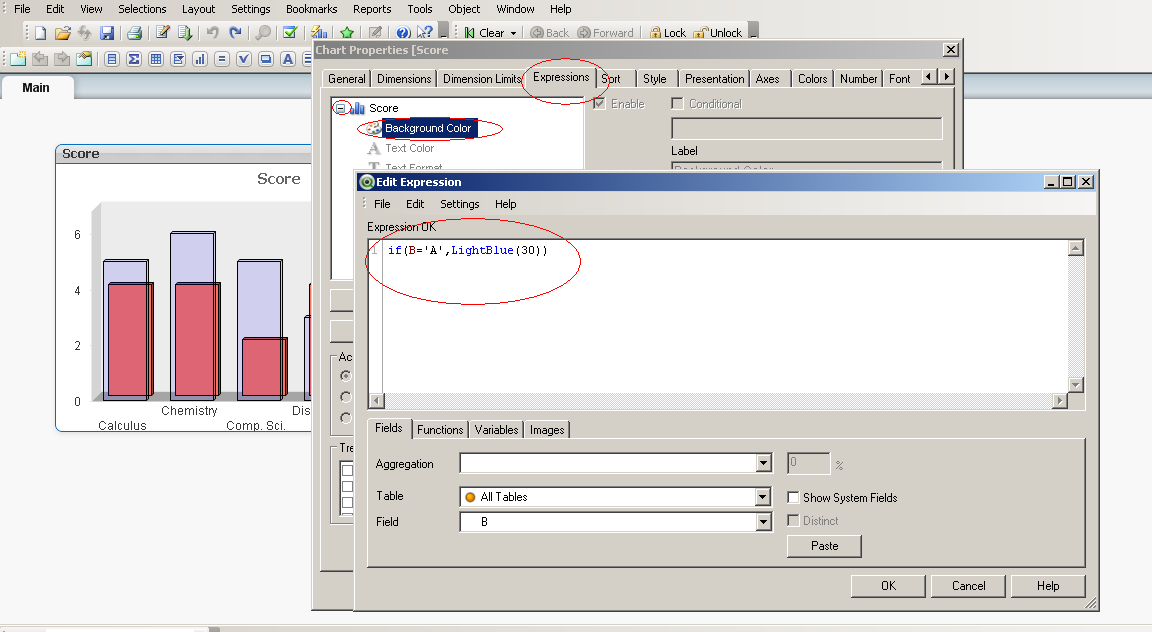
To set a transparent color, use a backgorund color attribute, like
=if(B='A',LightBlue(30))
where I check my dimension B if 'A' is the current dimension value, then apply lightblue() color with an alpha of 30.
To achieve the overlapping of bars, you can for example use the 3D bar style.
See attached.
- Mark as New
- Bookmark
- Subscribe
- Mute
- Subscribe to RSS Feed
- Permalink
- Report Inappropriate Content
hello swuehl
Please could you attach a screenshot where you use the formula =if(B='A',LightBlue(30)) in your graphic?
I got crazy looking for it and I can't find it. What's more i pasted your graphic in my projecte and instaly becomes opaque ...
What i really like is the transparent column in front
thanks in advanced.
- Mark as New
- Bookmark
- Subscribe
- Mute
- Subscribe to RSS Feed
- Permalink
- Report Inappropriate Content
HI
Try like this
Please close the thread by marking correct answer & give likes if you like the post.
- Mark as New
- Bookmark
- Subscribe
- Mute
- Subscribe to RSS Feed
- Permalink
- Report Inappropriate Content
You are my God ! it works !!!
Thanks a lot! I could never find it!.
thxsssssssssssssssssssssssssssss
- Mark as New
- Bookmark
- Subscribe
- Mute
- Subscribe to RSS Feed
- Permalink
- Report Inappropriate Content
Vladislav,
Could it be posible that you attach a copy of your graph please. I tried a lot to make a similar one but it was imposible. I can't get diferent expresions overlaped thet way you did.
Thanks in advanced