Unlock a world of possibilities! Login now and discover the exclusive benefits awaiting you.
- Qlik Community
- :
- All Forums
- :
- QlikView App Dev
- :
- Bar Graph
- Subscribe to RSS Feed
- Mark Topic as New
- Mark Topic as Read
- Float this Topic for Current User
- Bookmark
- Subscribe
- Mute
- Printer Friendly Page
- Mark as New
- Bookmark
- Subscribe
- Mute
- Subscribe to RSS Feed
- Permalink
- Report Inappropriate Content
Bar Graph
Hi ,
Let say i have 8 Feed Items and Threshold values for each Feed Item ,and the Reception Date is the X-Axis .
I am looking at using the barchart and line chart , when i did this i got only Few values plotted ,rest of them are not getting plotted , IS there a restrciton on how many expressons can be added in the BAR /Line chart ?
And also i want to mention name of the bar projection rather showin a legend . LEt say i have red bar projected for one of the feed out of 8 . I want to mention some info on Top of the Projection. How can i achieve it ?
And one more question when all the values are projected , let say i want to see only one Feed info , let say i clicked on Feed A , so that i want only that feed to displayed for all the days,and rest of them to be disappear temporarily . can you help me with the set analysis function to acheive this
- Mark as New
- Bookmark
- Subscribe
- Mute
- Subscribe to RSS Feed
- Permalink
- Report Inappropriate Content
Hi,
Bar chart allow 2 dimensions and 1 expression,
U have to use multiple dimensions and expressions u go for straight table or pivot table
- Mark as New
- Bookmark
- Subscribe
- Mute
- Subscribe to RSS Feed
- Permalink
- Report Inappropriate Content
Would it be possible to share a sample data or app you have ?
- Mark as New
- Bookmark
- Subscribe
- Mute
- Subscribe to RSS Feed
- Permalink
- Report Inappropriate Content
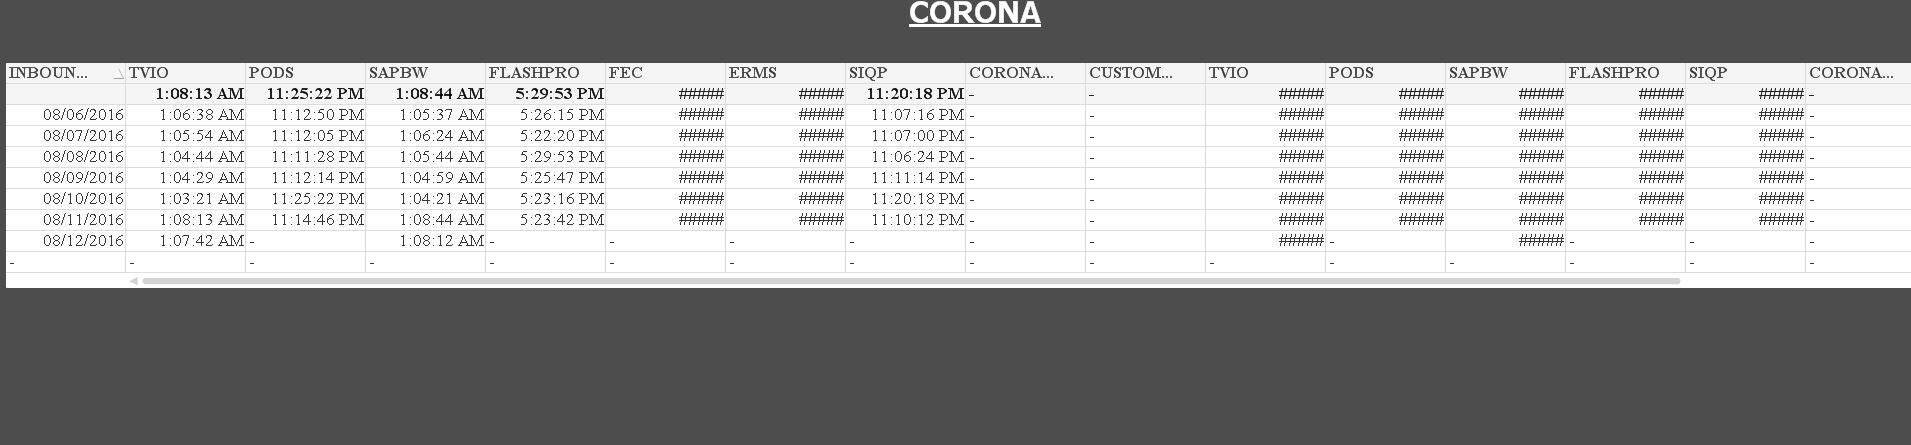
Bharat,
A bar chart can have dimensionality=3, which you can achieve by either 2 dimensions and an array of expressions (any number of expressions), or 3 dimensions and single expression.
In your chart, most of the expression returned null values or no values so it is not showing up in the x axis.
if you convert them in to straight table from general tab, you will see the null values. screenshot below.
- Mark as New
- Bookmark
- Subscribe
- Mute
- Subscribe to RSS Feed
- Permalink
- Report Inappropriate Content
CAn you please help me with these two
And also i want to mention name of the bar projection rather showin a legend . LEt say i have red bar projected for one of the feed out of 8 . I want to mention some info on Top of the Projection. How can i achieve it ?
And one more question when all the values are projected , let say i want to see only one Feed info , let say i clicked on Feed A , so that i want only that feed to displayed for all the days,and rest of them to be disappear temporarily . can you help me with the set analysis function to acheive this
- Mark as New
- Bookmark
- Subscribe
- Mute
- Subscribe to RSS Feed
- Permalink
- Report Inappropriate Content
Can you please help me with these two
And also i want to mention name of the bar projection rather showin a legend . LEt say i have red bar projected for one of the feed out of 8 . I want to mention some info on Top of the Projection. How can i achieve it ?
And one more question when all the values are projected , let say i want to see only one Feed info , let say i clicked on Feed A , so that i want only that feed to displayed for all the days,and rest of them to be disappear temporarily . can you help me with the set analysis function to acheive this