Unlock a world of possibilities! Login now and discover the exclusive benefits awaiting you.
- Qlik Community
- :
- All Forums
- :
- QlikView App Dev
- :
- Bar chart help
- Subscribe to RSS Feed
- Mark Topic as New
- Mark Topic as Read
- Float this Topic for Current User
- Bookmark
- Subscribe
- Mute
- Printer Friendly Page
- Mark as New
- Bookmark
- Subscribe
- Mute
- Subscribe to RSS Feed
- Permalink
- Report Inappropriate Content
Bar chart help
I am trying to create a bar chart with three dimensions. One is a year, month and other one is some field called "Even Trigger" which contains three data . i.e. 'Anniversary Date', 'associate activity' and 'job change'. Each of these is a trigger that will cause to remove accesses. My goal is to display a count of accesses removed based on each triggers contained in the event trigger field, based on year and month.
Is there a way to display data based on the three different triggers? Currently they are stacked on top of each other .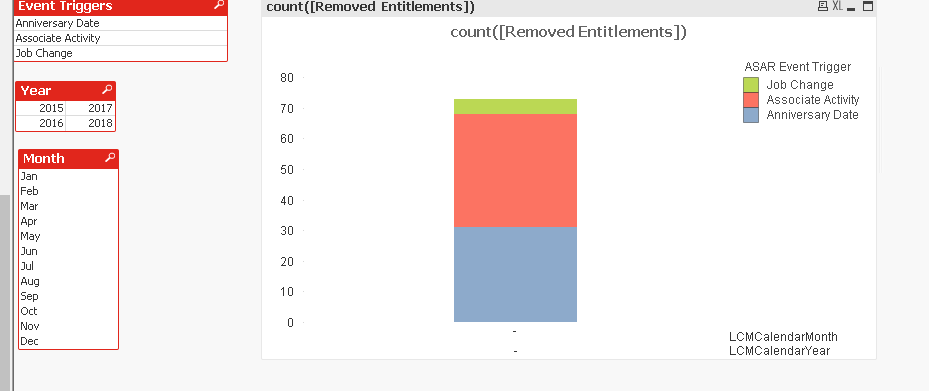
I want separate bars for job change, associate activity and anniversary date. Also the chart does not display the month and year user selected. I apologize if I sound confusing. I would appreciate the help.
- Mark as New
- Bookmark
- Subscribe
- Mute
- Subscribe to RSS Feed
- Permalink
- Report Inappropriate Content
If you want the separate bars for the each Trigger then you will need to create a separate expression for each trigger with set analysis like for job change
Count({<Eventtrigger = {'Job Change'}>}[RemovedEntitlements])
(change the field names as per your application)
- Mark as New
- Bookmark
- Subscribe
- Mute
- Subscribe to RSS Feed
- Permalink
- Report Inappropriate Content
Depending on your requirement, you could just add the 3 dimensions in a cyclic group or a drill down and make sure that in the Style tab of the bar chart properties the Subtype is set to Grouped not Stacked.