Unlock a world of possibilities! Login now and discover the exclusive benefits awaiting you.
- Qlik Community
- :
- All Forums
- :
- QlikView App Dev
- :
- Building a Time Sequence Chart
- Subscribe to RSS Feed
- Mark Topic as New
- Mark Topic as Read
- Float this Topic for Current User
- Bookmark
- Subscribe
- Mute
- Printer Friendly Page
- Mark as New
- Bookmark
- Subscribe
- Mute
- Subscribe to RSS Feed
- Permalink
- Report Inappropriate Content
Building a Time Sequence Chart
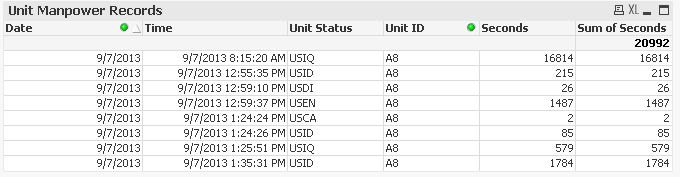
I have unit times, status and seconds spent at that status and I am hoping to construct a time line with the data. A snapshot of the data is shown below.
I have been successful in presenting this in a horizontal stacked bar chart, but the order of the bars is set by the Unit Status, not the Time variable. I know that this can be done, I just cannot figure out how. Any help is appreciated.
Bob
- Mark as New
- Bookmark
- Subscribe
- Mute
- Subscribe to RSS Feed
- Permalink
- Report Inappropriate Content
You should define sorting of the dimension Unit Status by expression min(Time)
- Mark as New
- Bookmark
- Subscribe
- Mute
- Subscribe to RSS Feed
- Permalink
- Report Inappropriate Content
We are looking at a QV function called Dual that seems to have promise. The difficulty we are having is expressing each change in status along a time line, not as a summ of all time at each status. Because these are emergency vehicle time and are operating 24/7/365, the zero time of whatever timeline we end up with will be dependant upon the resulting recors selected using the interface. The time interval used on the chart will be the (Max(time) - Min(tim)) and probably expressed as a fraction of 86400 seconds in a day. Thanks for your help to this point, and I look forward to hearing from anyone else who has an idea.
Thanks!
Bob