Unlock a world of possibilities! Login now and discover the exclusive benefits awaiting you.
- Qlik Community
- :
- All Forums
- :
- QlikView App Dev
- :
- Calculate Max Drawdown by ID
- Subscribe to RSS Feed
- Mark Topic as New
- Mark Topic as Read
- Float this Topic for Current User
- Bookmark
- Subscribe
- Mute
- Printer Friendly Page
- Mark as New
- Bookmark
- Subscribe
- Mute
- Subscribe to RSS Feed
- Permalink
- Report Inappropriate Content
Calculate Max Drawdown by ID
Hello everyone,
I need to calculate the max drawdown by ID with one expression. Drawdown is defined as:
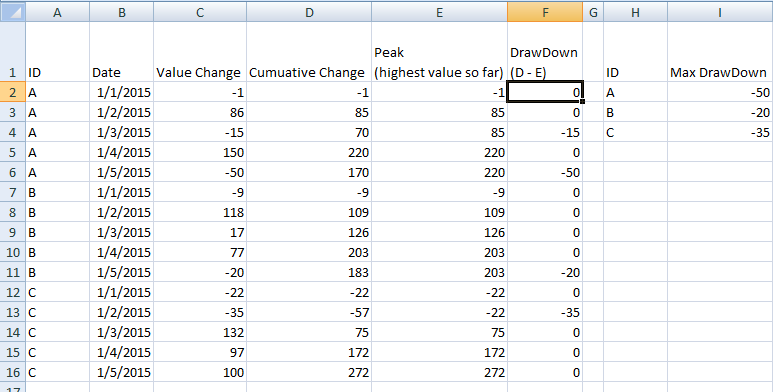
I have been able to replicate the above table in QlikView, but not the table to the right, which is by ID only, not displaying the Date dimension.
Can anyone help?
- Mark as New
- Bookmark
- Subscribe
- Mute
- Subscribe to RSS Feed
- Permalink
- Report Inappropriate Content
max( total <ID> DrawDown)
- Mark as New
- Bookmark
- Subscribe
- Mute
- Subscribe to RSS Feed
- Permalink
- Report Inappropriate Content
Hi Malek,
What I need to do is calculate the max drawdown by ID only (see the table to the right, you may have to scroll over a bit to see it). In other words, it will be a different table.
- Mark as New
- Bookmark
- Subscribe
- Mute
- Subscribe to RSS Feed
- Permalink
- Report Inappropriate Content
t1:
LOAD * INLINE [
ID, Date, Value Change
A, 1/1/2015, -1
A, 1/2/2015, 86
A, 1/3/2015, -13
A, 1/4/2015, 150
A, 1/5/2015, -50
B, 1/1/2015, -9
B, 1/2/2015, 118
B, 1/3/2015, 17
B, 1/4/2015, 77
B, 1/5/2015, -20
C, 1/1/2015, -22
C, 1/2/2015, -35
C, 1/3/2015, 132
C, 1/4/2015, 97
C, 1/5/2015, 100
];
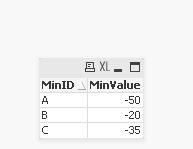
t2:
load
ID as MinID,
Min([Value Change]) as MinValue
resident t1
group by ID;
- Mark as New
- Bookmark
- Subscribe
- Mute
- Subscribe to RSS Feed
- Permalink
- Report Inappropriate Content
max( total <ID> DrawDown)
- Mark as New
- Bookmark
- Subscribe
- Mute
- Subscribe to RSS Feed
- Permalink
- Report Inappropriate Content
Hi Robert,
This is a good idea, but it won't work for two reasons:
- The population needs to be dynamic for the selection, including date
- The max drawdown is not equal to the min value. It is the min MTD value compared to the max MTD value
I think it'll need to be an expression on the chart.
- Mark as New
- Bookmark
- Subscribe
- Mute
- Subscribe to RSS Feed
- Permalink
- Report Inappropriate Content
Hi Dhananjay,
See my reply to Malek above.