Unlock a world of possibilities! Login now and discover the exclusive benefits awaiting you.
- Qlik Community
- :
- All Forums
- :
- QlikView App Dev
- :
- Calculate percentage of total for each month
Options
- Subscribe to RSS Feed
- Mark Topic as New
- Mark Topic as Read
- Float this Topic for Current User
- Bookmark
- Subscribe
- Mute
- Printer Friendly Page
Turn on suggestions
Auto-suggest helps you quickly narrow down your search results by suggesting possible matches as you type.
Showing results for
Not applicable
2015-04-22
05:05 PM
- Mark as New
- Bookmark
- Subscribe
- Mute
- Subscribe to RSS Feed
- Permalink
- Report Inappropriate Content
Calculate percentage of total for each month
Hi
I have some values for 3 different products across different months and would like to find out the percent of each product per month.
see below table for example.
| MonthYr | Product | Value |
| 01-2015 | Widget A | 5 |
| 01-2015 | Widget B | 4 |
| 01-2015 | Widget C | 6 |
| 02-2015 | Widget A | 7 |
| 02-2015 | Widget B | 9 |
| 02-2015 | Widget C | 1 |
| 03-2015 | Widget A | 2 |
| 03-2015 | Widget B | 8 |
| 03-2015 | Widget C | 3 |
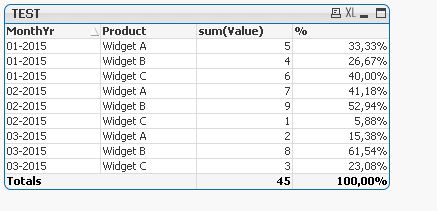
So for Widge A in 01-2015, I would like to find out that the percentage for Widget A is 33.33% (5 divided by 15; 15 is the total for the month of 01-2015). See below for the expected numbers for "Percent by Month"
| MonthYr | Product | Value | Percent by Month |
| 01-2015 | Widget A | 5 | 33.33% |
| 01-2015 | Widget B | 4 | 26.67% |
| 01-2015 | Widget C | 6 | 40.00% |
| 02-2015 | Widget A | 7 | 41.18% |
| 02-2015 | Widget B | 9 | 52.94% |
| 02-2015 | Widget C | 1 | 5.88% |
| 03-2015 | Widget A | 2 | 15.38% |
| 03-2015 | Widget B | 8 | 61.54% |
| 03-2015 | Widget C | 3 | 23.08% |
thanks very much
Louise
- Tags:
- new_to_qlikview
12,356 Views
1 Solution
Accepted Solutions
Anonymous
Not applicable
2015-04-22
05:17 PM
Author
- Mark as New
- Bookmark
- Subscribe
- Mute
- Subscribe to RSS Feed
- Permalink
- Report Inappropriate Content
3 Replies
Partner - Specialist III
2015-04-22
05:12 PM
- Mark as New
- Bookmark
- Subscribe
- Mute
- Subscribe to RSS Feed
- Permalink
- Report Inappropriate Content
you can use total for this
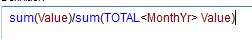
sum(total <MonthYr> Value)/sum(total <MonthYr,Product> Value)
Anonymous
Not applicable
2015-04-22
05:17 PM
Author
- Mark as New
- Bookmark
- Subscribe
- Mute
- Subscribe to RSS Feed
- Permalink
- Report Inappropriate Content
Hi,
Maybe, like this it.
Anonymous
Not applicable
2015-04-22
05:19 PM
Author
- Mark as New
- Bookmark
- Subscribe
- Mute
- Subscribe to RSS Feed
- Permalink
- Report Inappropriate Content