Unlock a world of possibilities! Login now and discover the exclusive benefits awaiting you.
- Qlik Community
- :
- All Forums
- :
- QlikView App Dev
- :
- Calculate sales data by Fiscal year and Calendar Y...
- Subscribe to RSS Feed
- Mark Topic as New
- Mark Topic as Read
- Float this Topic for Current User
- Bookmark
- Subscribe
- Mute
- Printer Friendly Page
- Mark as New
- Bookmark
- Subscribe
- Mute
- Subscribe to RSS Feed
- Permalink
- Report Inappropriate Content
Calculate sales data by Fiscal year and Calendar Year
Hi Guys
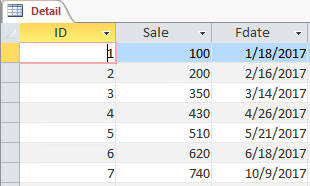
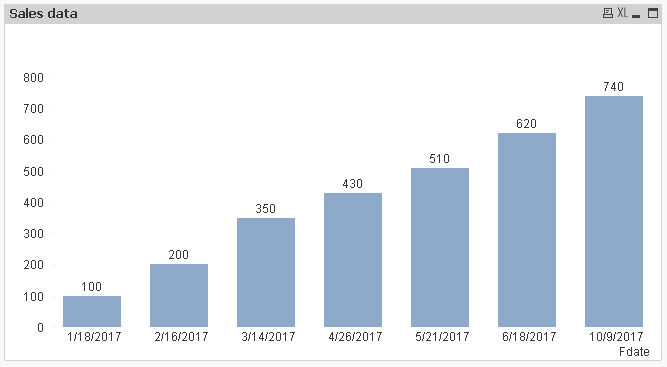
I created one table as bellow's screenshot, my purpose is, calculate the total sale data and display in chart.
And I need to show the chart by Fiscal year and Calendar Year, for calendar year, it's easy to make.
But for fiscal year, I have no idea how to make chart. Our fiscal year is defined like this:
4/1 ~ 9/30 belongs to the first half of that year, for example:2017/4/5 belongs to 2017A
10/1 ~ 3/31 belongs to the second half of that year, for example:2017/11/12 belongs to 2017B, 2018/3/3 also belongs to 2017B, but 2018/4/1 belongs to 2018A, and so on.
I checked in https://community.qlik.com/docs/DOC-7094# and https://community.qlik.com/blogs/qlikviewdesignblog/2013/05/28/fiscal-year, still don't know how to define in script.
Does anyone can give me a hand. Thanks a lot.
Accepted Solutions
- Mark as New
- Bookmark
- Subscribe
- Mute
- Subscribe to RSS Feed
- Permalink
- Report Inappropriate Content
- Mark as New
- Bookmark
- Subscribe
- Mute
- Subscribe to RSS Feed
- Permalink
- Report Inappropriate Content
You need to create it in calendar
- Mark as New
- Bookmark
- Subscribe
- Mute
- Subscribe to RSS Feed
- Permalink
- Report Inappropriate Content
Please try creating some mapping file as attached and Proceed.
There may be some easy solutions also available. Please wait for other's response
- Mark as New
- Bookmark
- Subscribe
- Mute
- Subscribe to RSS Feed
- Permalink
- Report Inappropriate Content
PFA with practical, write just below in calendar
if(Month(DATE)>=4 and Month(DATE)<=9,Year(DATE)&'A',
if(Month(DATE)>=10,Year(DATE)&'B',
if(Month(DATE)<=3,Year(AddYears(DATE,-1))&'B'))) as HalfYear
- Mark as New
- Bookmark
- Subscribe
- Mute
- Subscribe to RSS Feed
- Permalink
- Report Inappropriate Content
Hi Mangal
Sorry, I'm still not clear how to modify your script to match my Access table...
I have uploaded by attachment. Could you help to tell me how to insert in calendar.
Thanks a lot!
- Mark as New
- Bookmark
- Subscribe
- Mute
- Subscribe to RSS Feed
- Permalink
- Report Inappropriate Content
Hello ,
Please find attached
- Mark as New
- Bookmark
- Subscribe
- Mute
- Subscribe to RSS Feed
- Permalink
- Report Inappropriate Content
Hi Mangal
I checked your modified script, seems you removed the database connection function, but I want to keep the DB connection statement, because the data source is coming from MS Access table. So how to revise?
- Mark as New
- Bookmark
- Subscribe
- Mute
- Subscribe to RSS Feed
- Permalink
- Report Inappropriate Content
I know how to modify and it is working now. Thank you!