Unlock a world of possibilities! Login now and discover the exclusive benefits awaiting you.
- Qlik Community
- :
- All Forums
- :
- QlikView App Dev
- :
- Calculated Dimension using Input Fields for Trelli...
- Subscribe to RSS Feed
- Mark Topic as New
- Mark Topic as Read
- Float this Topic for Current User
- Bookmark
- Subscribe
- Mute
- Printer Friendly Page
- Mark as New
- Bookmark
- Subscribe
- Mute
- Subscribe to RSS Feed
- Permalink
- Report Inappropriate Content
Calculated Dimension using Input Fields for Trellis Chart
I would like to provide my users an ability to dynamically interact with a large data set to create a customer trellis chart. The goal is to demonstrate changes over a user defined series of periods (weeks, months, quarters, etc).
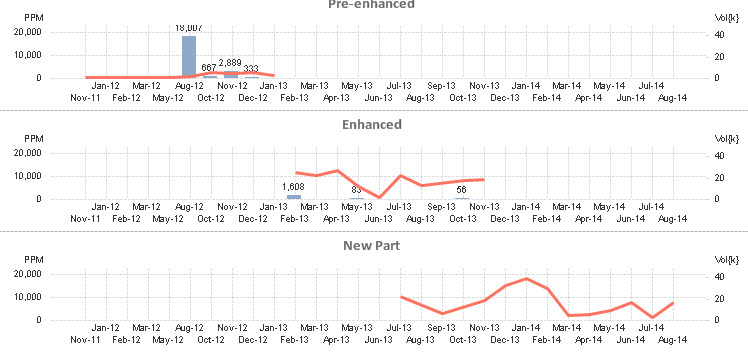
Example: For a Combination Line and Bar Chart that shows Shipments (Line) and Returns (Bar) , a user would come in and enter into a series of Input Boxes
Pedigree 0 - 'Baseline'
Start Date
End Date
Pedigree 1 = Change 1
Start Date
End Date
Pedigree n = Change = n
Start Date
End Date
Then the chart would pick up 'Pedigree' as a Dimension and display a trellis of the date from Pedigree Start Date 0 to Pedigree n End Date.
The use would be able to create something like the example below.