Unlock a world of possibilities! Login now and discover the exclusive benefits awaiting you.
- Qlik Community
- :
- All Forums
- :
- QlikView App Dev
- :
- Calculated Week Dimension.
- Subscribe to RSS Feed
- Mark Topic as New
- Mark Topic as Read
- Float this Topic for Current User
- Bookmark
- Subscribe
- Mute
- Printer Friendly Page
- Mark as New
- Bookmark
- Subscribe
- Mute
- Subscribe to RSS Feed
- Permalink
- Report Inappropriate Content
Calculated Week Dimension.
Hi,
I have Week & Month as a field. In which I have to show the below chart.
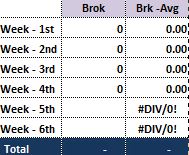
I am confused how to describe Week.
I have one variable of vMaxMonth which will give me Max month Week.
Here For Feb Month I have Week as 5 & 6 Now I want Week 5 to be renamed as Week-1st & then goes on. its should also change according to months get changed.
Thanks in advance.
Regards,
Renuka S
Accepted Solutions
- Mark as New
- Bookmark
- Subscribe
- Mute
- Subscribe to RSS Feed
- Permalink
- Report Inappropriate Content
I think, you can add a new field in your data model, there calculate num of week for datefield in each month:
Week(today()) - Week(MonthEnd(AddMonths(today(),-1))) as NumOfWeekInMonth
- Mark as New
- Bookmark
- Subscribe
- Mute
- Subscribe to RSS Feed
- Permalink
- Report Inappropriate Content
Provide some more data.... may be sample data in excel along with the required column you need.
- Mark as New
- Bookmark
- Subscribe
- Mute
- Subscribe to RSS Feed
- Permalink
- Report Inappropriate Content
if you have date field then try like this :
use week() function to generate the week number and create table with the group by over the month and have a autonumber over the same...this will create a table data according to your requirement
- Mark as New
- Bookmark
- Subscribe
- Mute
- Subscribe to RSS Feed
- Permalink
- Report Inappropriate Content
I think, you can add a new field in your data model, there calculate num of week for datefield in each month:
Week(today()) - Week(MonthEnd(AddMonths(today(),-1))) as NumOfWeekInMonth
- Mark as New
- Bookmark
- Subscribe
- Mute
- Subscribe to RSS Feed
- Permalink
- Report Inappropriate Content
You could use a calculated dimension like these here:
=if(Week <= vMaxWeek, dual('Week - ' & pick(Week, '1st','2nd','3rd','4th','5th','6th'), Week))
- Marcus
- Mark as New
- Bookmark
- Subscribe
- Mute
- Subscribe to RSS Feed
- Permalink
- Report Inappropriate Content
Hi,
Thanks for your prompt reply.
I tried this but I get the output as Week - 5th & Week - 6th.
But I want Week 5 to be renamed as Week - 1st instead of Week - 5th.
Regards,
Renuka S
- Mark as New
- Bookmark
- Subscribe
- Mute
- Subscribe to RSS Feed
- Permalink
- Report Inappropriate Content
Then you need to reverse the order within the pick-function and/or change the sort-order of these dimension within the sort tab.
- Marcus
- Mark as New
- Bookmark
- Subscribe
- Mute
- Subscribe to RSS Feed
- Permalink
- Report Inappropriate Content
Thank You. This worked out. 🙂