Unlock a world of possibilities! Login now and discover the exclusive benefits awaiting you.
- Qlik Community
- :
- All Forums
- :
- QlikView App Dev
- :
- Calculated an average by month where the dimension...
- Subscribe to RSS Feed
- Mark Topic as New
- Mark Topic as Read
- Float this Topic for Current User
- Bookmark
- Subscribe
- Mute
- Printer Friendly Page
- Mark as New
- Bookmark
- Subscribe
- Mute
- Subscribe to RSS Feed
- Permalink
- Report Inappropriate Content
Calculated an average by month where the dimension is hour
Hello to all comunity members,
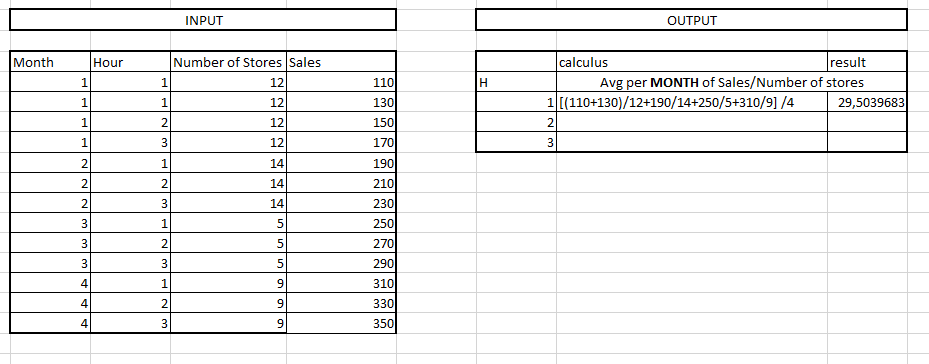
Having the table below:

I want in a chart expression calculate BY hour the average BY month of Sales/Number of stores. Can any help me to formulate the right expression?
Best regards
Accepted Solutions
- Mark as New
- Bookmark
- Subscribe
- Mute
- Subscribe to RSS Feed
- Permalink
- Report Inappropriate Content
Try avg(aggr(sum(Sales)/max([Number of Stores]),Month,Hour))
talk is cheap, supply exceeds demand
- Mark as New
- Bookmark
- Subscribe
- Mute
- Subscribe to RSS Feed
- Permalink
- Report Inappropriate Content
Create a straight table object and use Month as dimension and avg([Number of stores]) avg(Sales) as expressions
talk is cheap, supply exceeds demand
- Mark as New
- Bookmark
- Subscribe
- Mute
- Subscribe to RSS Feed
- Permalink
- Report Inappropriate Content
Even if I want to display values by hour not by month?
- Mark as New
- Bookmark
- Subscribe
- Mute
- Subscribe to RSS Feed
- Permalink
- Report Inappropriate Content
What I did is that I created a chart, I then choose Hour as a dimension and put the following expression:
Aggr(Avg(Sales/Number Of Stores),M)
But I had no displayed data
- Mark as New
- Bookmark
- Subscribe
- Mute
- Subscribe to RSS Feed
- Permalink
- Report Inappropriate Content
Please post the result table you expect.
talk is cheap, supply exceeds demand
- Mark as New
- Bookmark
- Subscribe
- Mute
- Subscribe to RSS Feed
- Permalink
- Report Inappropriate Content
I gave an example of how I want to calculated the average that I want to calculate. Maybe I didn't explain well what I wanted, sory for that
- Mark as New
- Bookmark
- Subscribe
- Mute
- Subscribe to RSS Feed
- Permalink
- Report Inappropriate Content
Try avg(aggr(sum(Sales)/max([Number of Stores]),Month,Hour))
talk is cheap, supply exceeds demand
- Mark as New
- Bookmark
- Subscribe
- Mute
- Subscribe to RSS Feed
- Permalink
- Report Inappropriate Content
Accurate answer as always, many thanks Gysbert.
Best regards,
Yasser.