Unlock a world of possibilities! Login now and discover the exclusive benefits awaiting you.
- Qlik Community
- :
- All Forums
- :
- QlikView App Dev
- :
- Calculating Average when using cross table
- Subscribe to RSS Feed
- Mark Topic as New
- Mark Topic as Read
- Float this Topic for Current User
- Bookmark
- Subscribe
- Mute
- Printer Friendly Page
- Mark as New
- Bookmark
- Subscribe
- Mute
- Subscribe to RSS Feed
- Permalink
- Report Inappropriate Content
Calculating Average when using cross table
Hello
Previously I created a cross table to show data on a line chart in a specific manner.
Original data:
| Project | Cost1 | Cost2 | Cost3 |
| A | 1 | 5 | 6 |
| B | 3 | 3 | 6 |
| C | 1 | 4 | 3 |
| D | 3 | 4 | 5 |
| E | 4 | 6 | 4 |
Cross table data:
| Project | Cost | Value |
| A | Cost1 | 1 |
| A | Cost2 | 5 |
| A | Cost3 | 6 |
| B | Cost1 | 3 |
| B | Cost2 | 3 |
| etc | ect | etc |
This was the result, and it is great:
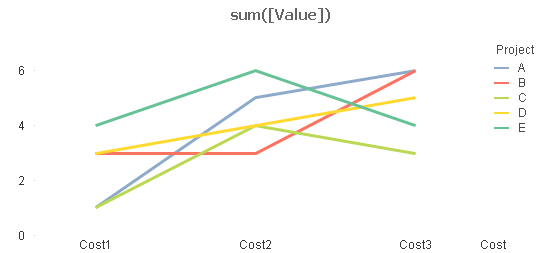
I now want to show the Average Cost for all of the Project at the specific Cost dimension.
Could you please aid me as to how I can still show the line for each Project, as well as a line for the average Cost?
I did try to get this working by using the aggr function and adding more expressions, and also by altering the load script, but I just can't get the solution to a seemingly simple problem. Also adding the Average trendline doesnt work, as it gives the Average for each Project.
- Mark as New
- Bookmark
- Subscribe
- Mute
- Subscribe to RSS Feed
- Permalink
- Report Inappropriate Content
Hi,
Try this expression for avg TrendLine
( Avg({<Project=>} Cost1) + Avg({<Project=>} Cost2) + Avg({<Project=>} Cost3) ) /3
Regards,
Nirav Bhimani
- Mark as New
- Bookmark
- Subscribe
- Mute
- Subscribe to RSS Feed
- Permalink
- Report Inappropriate Content
Thank you for your answer.
When I put that in as an expression, this is my result:
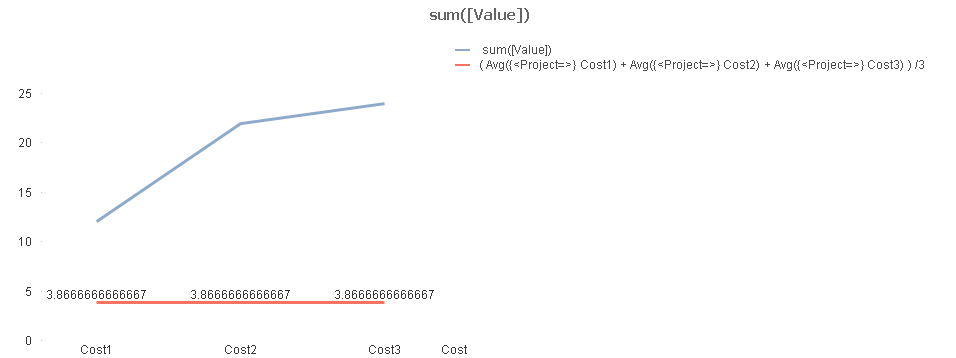
When I change the Cost1, Cost2, Cost3 to [Value], it calculates the Average correctly, but still compresses the other lines:
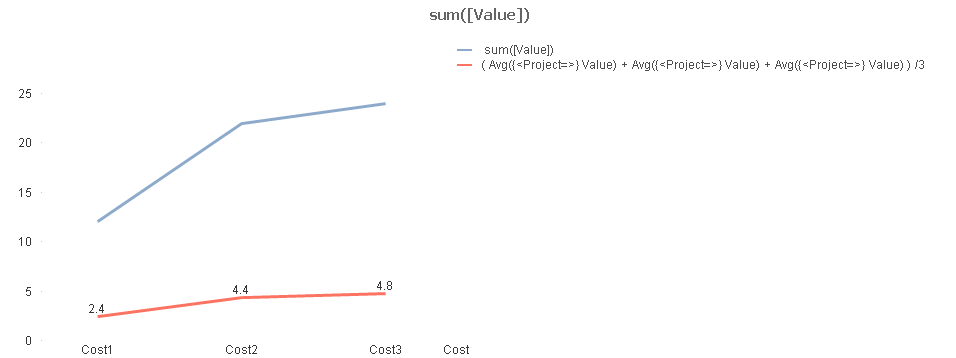
I want to have all the lines of the Projects still visible as well.
- Mark as New
- Bookmark
- Subscribe
- Mute
- Subscribe to RSS Feed
- Permalink
- Report Inappropriate Content
hi,
If you fetch data from table, then you can use CASE function.
like
SELECT project, SUM(CASE WHEN cost = 'Cost1' THEN value ELSE 0 END) AS Cost1, SUM(CASE WHEN cost = 'Cost2' THEN value ELSE 0 END) AS Cost2, SUM(CASE WHEN cost = 'Cost3' THEN value ELSE 0 END) AS Cost3 from table GROUP BY project;
--Prabhu Ch