Unlock a world of possibilities! Login now and discover the exclusive benefits awaiting you.
- Qlik Community
- :
- All Forums
- :
- QlikView App Dev
- :
- Calculating the Max of a cumulative progression
- Subscribe to RSS Feed
- Mark Topic as New
- Mark Topic as Read
- Float this Topic for Current User
- Bookmark
- Subscribe
- Mute
- Printer Friendly Page
- Mark as New
- Bookmark
- Subscribe
- Mute
- Subscribe to RSS Feed
- Permalink
- Report Inappropriate Content
Calculating the Max of a cumulative progression
Hello Qlik Community,
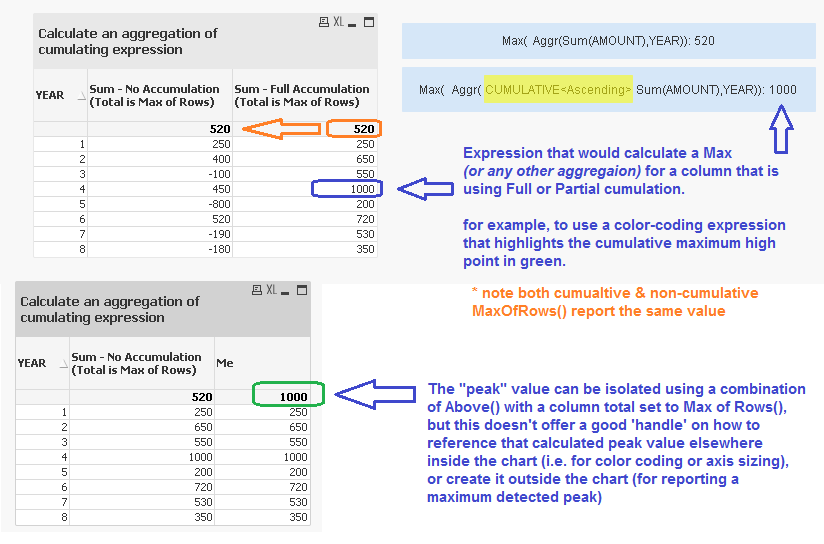
Can anyone help with an expression or technique that would help isolate the "peak" value of a cumulative expression, when assigned in a straight table?
In the following set of records, I'd like to be able to isolate when the cumulative value peaked, and what that peak value was, but if possible by doing this entirely in user-interface (i.e. not adding any aggregation tables, or rescripting).
Is there a way to isolate the cumulative maximum of an expression when aggregated across a dimension?
[INTERVAL_ATTRIBUTES]:
LOAD * INLINE [
YEAR, AMOUNT
1, 250
2, 400
3, -100
4, 450
5, -800
6, 520
7, -190
8, -180
];
Accepted Solutions
- Mark as New
- Bookmark
- Subscribe
- Mute
- Subscribe to RSS Feed
- Permalink
- Report Inappropriate Content
Try this expression in a text box:
=Max(Aggr(RangeSum(Above(Sum(AMOUNT), 0, 99999)), YEAR))
Output is 1000
Is this what you were looking for? (PFA)
Best,
Sunny
- Mark as New
- Bookmark
- Subscribe
- Mute
- Subscribe to RSS Feed
- Permalink
- Report Inappropriate Content
Try this expression in a text box:
=Max(Aggr(RangeSum(Above(Sum(AMOUNT), 0, 99999)), YEAR))
Output is 1000
Is this what you were looking for? (PFA)
Best,
Sunny
- Mark as New
- Bookmark
- Subscribe
- Mute
- Subscribe to RSS Feed
- Permalink
- Report Inappropriate Content
Yes, sunindia, thank you!
RangeSum ( Above ()) combinations, brilliant!
- Mark as New
- Bookmark
- Subscribe
- Mute
- Subscribe to RSS Feed
- Permalink
- Report Inappropriate Content
Awesome! 