Unlock a world of possibilities! Login now and discover the exclusive benefits awaiting you.
- Qlik Community
- :
- All Forums
- :
- QlikView App Dev
- :
- Calculation Dimension
- Subscribe to RSS Feed
- Mark Topic as New
- Mark Topic as Read
- Float this Topic for Current User
- Bookmark
- Subscribe
- Mute
- Printer Friendly Page
- Mark as New
- Bookmark
- Subscribe
- Mute
- Subscribe to RSS Feed
- Permalink
- Report Inappropriate Content
Calculation Dimension
Hi All,
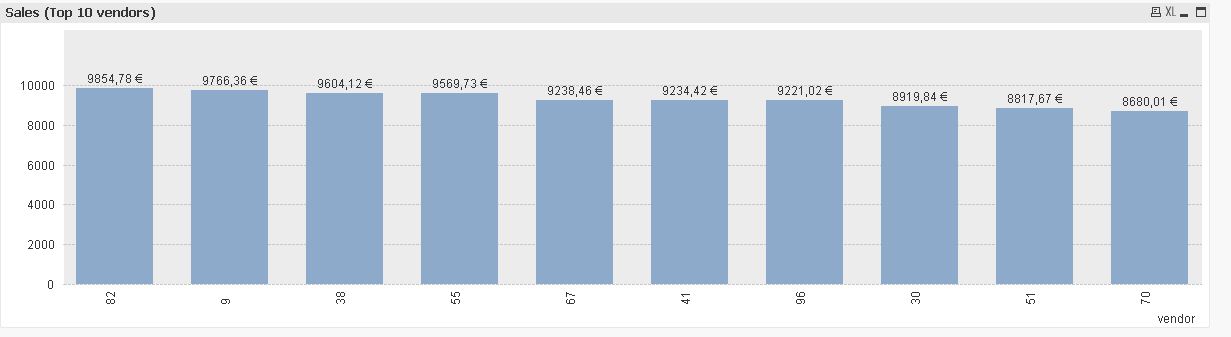
I need to create a calculate dimension as Top Vendors. like
Top Vendors
Top 10
Top 20
If i click Top 10 application should display top 10 vendors where i used vendor as dimension across application.
When i click Top 20 application should display top 20 vendors where i used vendor as dimension across application.
Regards,
Nihhal.
- « Previous Replies
-
- 1
- 2
- Next Replies »
Accepted Solutions
- Mark as New
- Bookmark
- Subscribe
- Mute
- Subscribe to RSS Feed
- Permalink
- Report Inappropriate Content
I resolved it. Please see below steps.
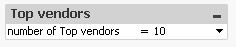
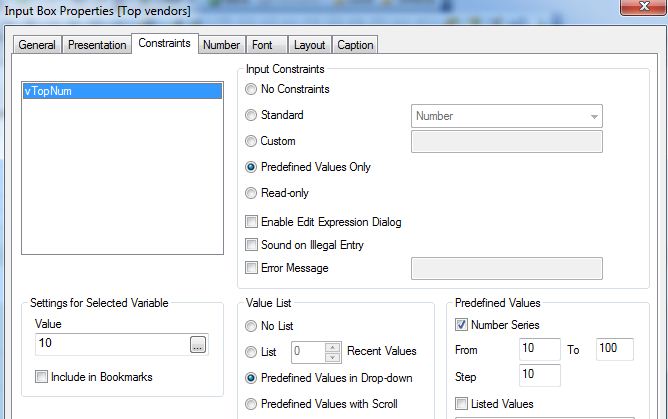
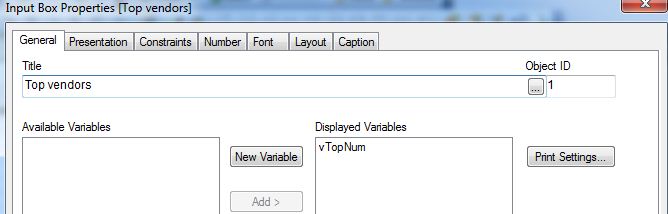
1. Create variable and use it as input box
2. use variable wherever you used vendor dimension (charts..etc.).
3. Give values in input box like 10, 20...etc.
Regards,
Nihhal.
- Mark as New
- Bookmark
- Subscribe
- Mute
- Subscribe to RSS Feed
- Permalink
- Report Inappropriate Content
Hi,
have a look at attached application.
Regards
ASHFAQ
- Mark as New
- Bookmark
- Subscribe
- Mute
- Subscribe to RSS Feed
- Permalink
- Report Inappropriate Content
Calulated dimension: two expressions:
1. For top ten (use something like: if(aggr(rank(sum(sales)),vendors)<=10,vendors)
2. For top twenty (use something like: if(aggr(rank(sum(sales)),vendors)<=20,vendors)
Now use conditional enablement of these dimensions, use expression like:
1. =Max(If([Top Vendors]='Top 10', 1,0)
2. =Max(If([Top Vendors]='Top 20', 1,0)
Similarly with the help of set analysis, you can do it in the expression side also(conditional enablement of expressions).
Update: PFA
- Mark as New
- Bookmark
- Subscribe
- Mute
- Subscribe to RSS Feed
- Permalink
- Report Inappropriate Content
Hi,
Why dont you try with variable
Do like this,
Create one input box to allow user to set value i.e 10 or 20.
Use that variables in chart to display that much top Vendor.
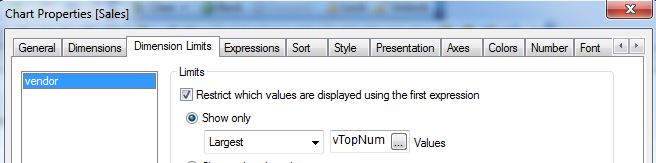
For that you can take Vendor as Dimension and then
Go to Chart Prpoerty-> Dimension Limits->Limits->Show Largest->In Values (Insert Variable Name)
Or
You can create Two chart
one with Top 10 and another with Top 20
and based on selection display those chart
Regards
Please appreciate our Qlik community members by giving Kudos for sharing their time for your query. If your query is answered, please mark the topic as resolved 🙂
- Mark as New
- Bookmark
- Subscribe
- Mute
- Subscribe to RSS Feed
- Permalink
- Report Inappropriate Content
Hi,
one solution might be:
hope this helps
regards
Marco
- Mark as New
- Bookmark
- Subscribe
- Mute
- Subscribe to RSS Feed
- Permalink
- Report Inappropriate Content
Nihal,
This may help you, see the attachment.
Thanks,
AS
- Mark as New
- Bookmark
- Subscribe
- Mute
- Subscribe to RSS Feed
- Permalink
- Report Inappropriate Content
Thanks for reply Mohammed.
I have gone through your application but my requirement is different, please see above my discussion.
Regards,
Nihhal.
- Mark as New
- Bookmark
- Subscribe
- Mute
- Subscribe to RSS Feed
- Permalink
- Report Inappropriate Content
Hi tresesco, thanks for your response
i have seen your application, in application sum(value) chart has two columns as top 10 and top 20.
However my requirement is if i select top 10 in list, chart should show top 10 it is fine another thing top 20 it also fine, where i suspecting is if there is no selection at top vendors list. chart displaying top 10 and top 20 columns. actually i want to show without selection full data like one column as vendors. i hope you understand my question.
Regards,
Nihhal.
- Mark as New
- Bookmark
- Subscribe
- Mute
- Subscribe to RSS Feed
- Permalink
- Report Inappropriate Content
My requirement was different.
- Mark as New
- Bookmark
- Subscribe
- Mute
- Subscribe to RSS Feed
- Permalink
- Report Inappropriate Content
Use dimension limit and a variable to pass the value
- « Previous Replies
-
- 1
- 2
- Next Replies »