Unlock a world of possibilities! Login now and discover the exclusive benefits awaiting you.
- Qlik Community
- :
- All Forums
- :
- QlikView App Dev
- :
- Calculation of active and inactive values in pivot...
- Subscribe to RSS Feed
- Mark Topic as New
- Mark Topic as Read
- Float this Topic for Current User
- Bookmark
- Subscribe
- Mute
- Printer Friendly Page
- Mark as New
- Bookmark
- Subscribe
- Mute
- Subscribe to RSS Feed
- Permalink
- Report Inappropriate Content
Calculation of active and inactive values in pivot table
Hello all,
I am new to qlikview
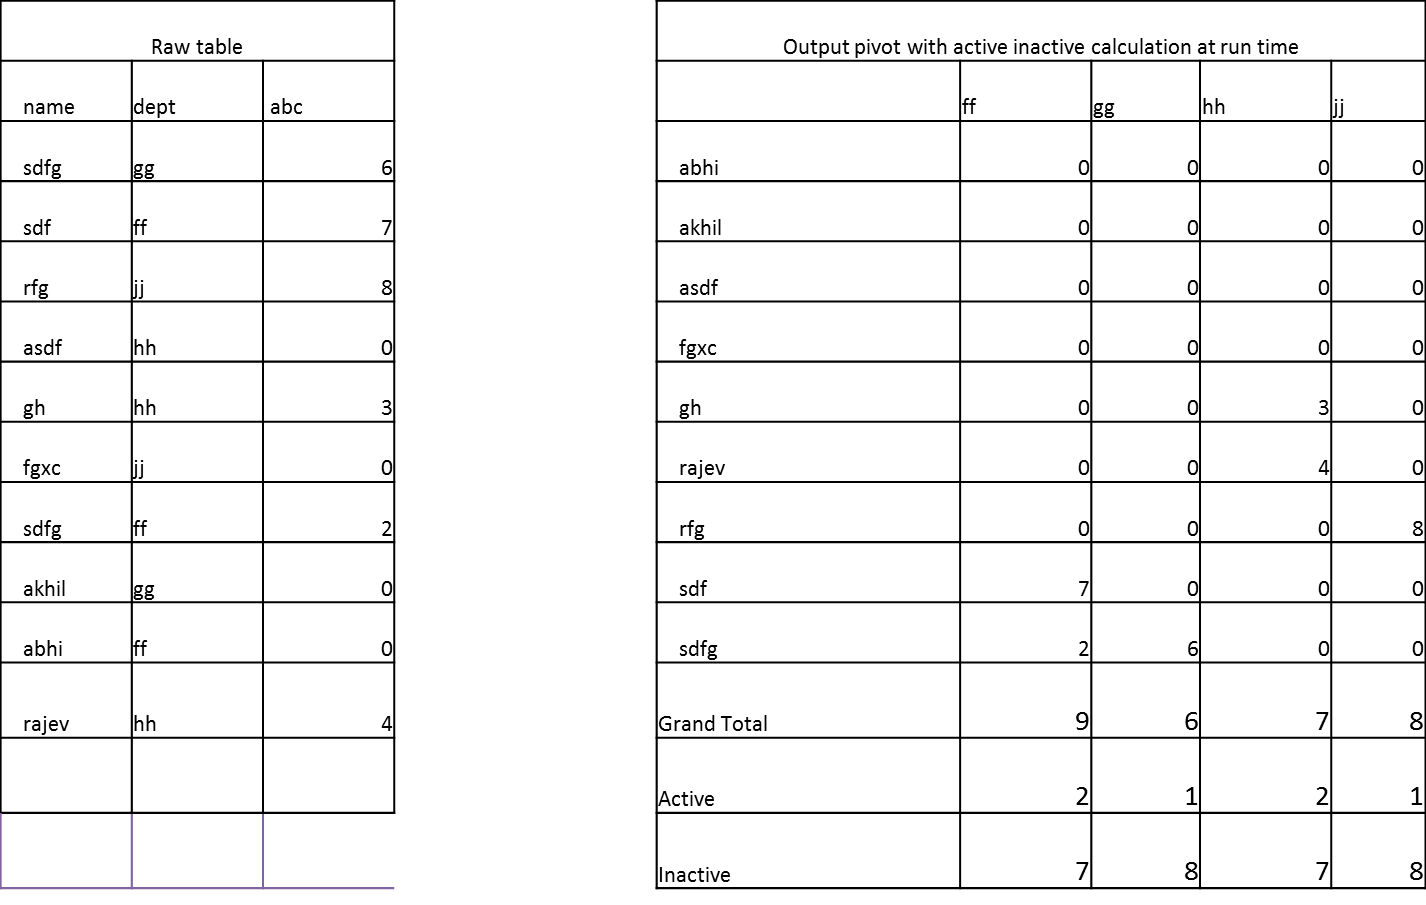
I was working on a report where I have to show count of non-zero values as active and zero values as inactive in pivot table.
when dealing with multiple dimensions , if they are in rows then the values calculated in script works as in chart I
But when I transpose one dimension to column , then this fails as in chart II
I have attached the qvw file for reference ....
Plase help me out in this case.
Thanks for considerations and support
- Mark as New
- Bookmark
- Subscribe
- Mute
- Subscribe to RSS Feed
- Permalink
- Report Inappropriate Content
ANY HELP FROM ANY BODY!!!!!!!!!!!!!!!!!!!!!!!
- Mark as New
- Bookmark
- Subscribe
- Mute
- Subscribe to RSS Feed
- Permalink
- Report Inappropriate Content
there are 4 different table in ur application..there is no link ..
try to make one table or try to link table..
regards-Bika
- Mark as New
- Bookmark
- Subscribe
- Mute
- Subscribe to RSS Feed
- Permalink
- Report Inappropriate Content
Thanks for showing concern,
Actualy my concern is only as following,
suppose as in below image there one raw table , of which I have to create a pivot table having one or more dimension in rows and one or more dimensions in columns.
Then the Active and Inactive values should be calculated as per non zero and zero values available in pivot table.
Hope I am able to explain my problem.
 Hi,
Hi,
- Mark as New
- Bookmark
- Subscribe
- Mute
- Subscribe to RSS Feed
- Permalink
- Report Inappropriate Content
Add this expression oin this script
If(Count(fieldname)<0 or Count(fieldname)>0,'Active','Inactive') as Status(fieldname2)
[always make sure that test any fieldvalue or fieldname in text box]
- Mark as New
- Bookmark
- Subscribe
- Mute
- Subscribe to RSS Feed
- Permalink
- Report Inappropriate Content
Thanks but I cannot get values as per my output chart....
