Unlock a world of possibilities! Login now and discover the exclusive benefits awaiting you.
- Qlik Community
- :
- All Forums
- :
- QlikView App Dev
- :
- Calculation of percentual increase of calculated d...
Options
- Subscribe to RSS Feed
- Mark Topic as New
- Mark Topic as Read
- Float this Topic for Current User
- Bookmark
- Subscribe
- Mute
- Printer Friendly Page
Turn on suggestions
Auto-suggest helps you quickly narrow down your search results by suggesting possible matches as you type.
Showing results for
Not applicable
2014-09-12
05:07 PM
- Mark as New
- Bookmark
- Subscribe
- Mute
- Subscribe to RSS Feed
- Permalink
- Report Inappropriate Content
Calculation of percentual increase of calculated dimension
Hi, QV community
I would be grateful if someone could help me with the following issue.
I set a simple dataset with dummy data.
I need to calculate the percentual difference between hist.sales and forecast
In the pivot chart, I added a calculated dimension =(fcst-hist)/hist
I works fine for lines, but I need to make the same operation with totals (as Excel pivot charts automatically do!!!)
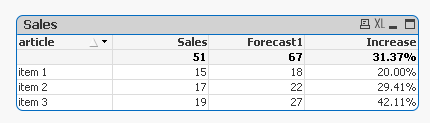
In short, I need QlikView to calculate and show the value in yellow
(sum(fcst)-sum(sales))/sum(sales)
Thank you in advance!
base data
| article | Hist.sales | Forecast | % increase |
| item 1 | 15 | 18 | 20,00% |
| item 2 | 17 | 22 | 29,41% |
| item 3 | 19 | 27 | 42,11% |
intended report
| Etiquetas de fila | Hist.sales | Forecast | % increase |
| item 1 | 15 | 18 | 20,00% |
| item 2 | 17 | 22 | 29,41% |
| item 3 | 19 | 27 | 42,11% |
| Total general | 51 | 67 | 31,37% |
- Tags:
- new_to_qlikview
474 Views
2 Replies
Specialist III
2014-09-12
05:40 PM
- Mark as New
- Bookmark
- Subscribe
- Mute
- Subscribe to RSS Feed
- Permalink
- Report Inappropriate Content
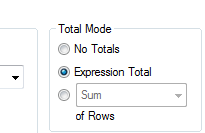
If you set the Total mode to expression total, you get the desired result.
Not applicable
2014-09-12
10:40 PM
Author
- Mark as New
- Bookmark
- Subscribe
- Mute
- Subscribe to RSS Feed
- Permalink
- Report Inappropriate Content
Now it works! Thank you for your help!
331 Views