Unlock a world of possibilities! Login now and discover the exclusive benefits awaiting you.
- Qlik Community
- :
- All Forums
- :
- QlikView App Dev
- :
- Calculation problems in a Chart
- Subscribe to RSS Feed
- Mark Topic as New
- Mark Topic as Read
- Float this Topic for Current User
- Bookmark
- Subscribe
- Mute
- Printer Friendly Page
- Mark as New
- Bookmark
- Subscribe
- Mute
- Subscribe to RSS Feed
- Permalink
- Report Inappropriate Content
Calculation problems in a Chart
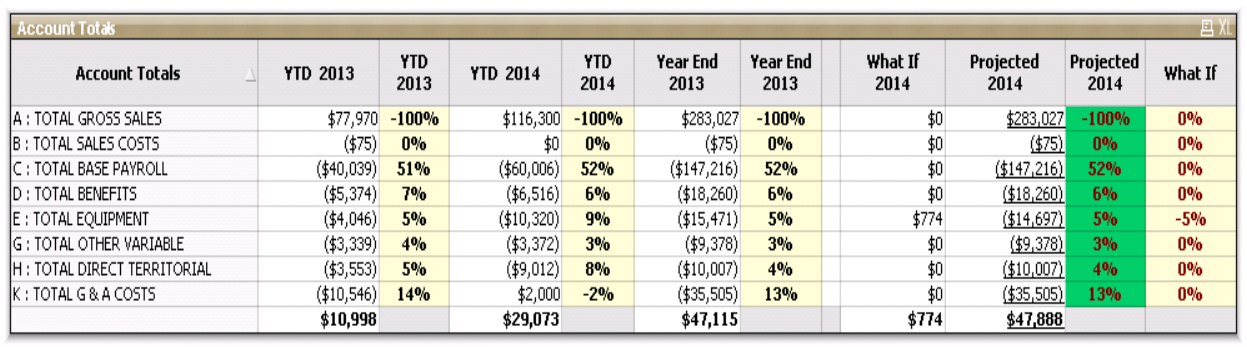
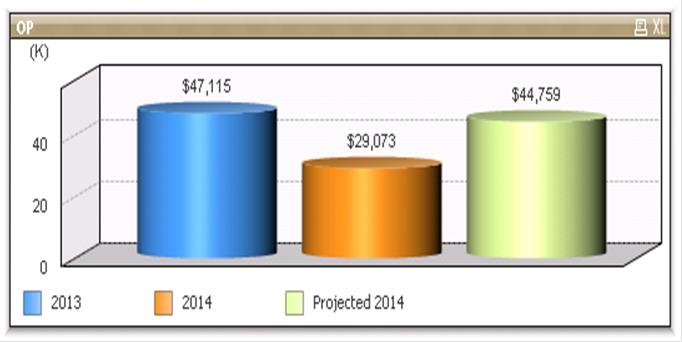
I have a small problem where the above image is correct and the chart below is wrong. The column labeled Projected 2014 should match on both. I am using an InputSum with a variable on the top for the What If column (all calculations on the top are correct). The bottom chart I use the same calculation however it's doing the calculation on the total line also. Is there a way to only use the detail lines for the chart and ignore the total?
Here is the calculation I am using on both:
sum({} [In company code currency_HSL] * -1) + sum({} [In company code currency_HSL] * -1) * InputSum(vPCT) + sum({} [In company code currency_HSL] * -1) * InputSum(vPCT) + sum({} [In company code currency_HSL] * -1) * InputSum(vPCT) + sum({} [In company code currency_HSL] * -1) * InputSum(vPCT) + sum({} [In company code currency_HSL] * -1) * InputSum(vPCT) + sum({} [In company code currency_HSL] * -1) * InputSum(vPCT) + sum({} [In company code currency_HSL] * -1) * InputSum(vPCT) + sum({} [In company code currency_HSL] * -1) * InputSum(vPCT) + sum({} [In company code currency_HSL] * -1) * InputSum(vPCT) + sum({} [In company code currency_HSL] * -1) * InputSum(vPCT) + sum({} [In company code currency_HSL] * -1) * InputSum(vPCT) + sum({} [In company code currency_HSL] * -1) * InputSum(vPCT)
- Tags:
- calulation