Unlock a world of possibilities! Login now and discover the exclusive benefits awaiting you.
- Qlik Community
- :
- All Forums
- :
- QlikView App Dev
- :
- Calculation
- Subscribe to RSS Feed
- Mark Topic as New
- Mark Topic as Read
- Float this Topic for Current User
- Bookmark
- Subscribe
- Mute
- Printer Friendly Page
- Mark as New
- Bookmark
- Subscribe
- Mute
- Subscribe to RSS Feed
- Permalink
- Report Inappropriate Content
Calculation
Hi Friends
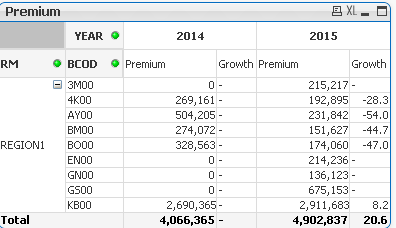
I have apivot table in my QV document which is attached here to. In this data I have 4 regions with 5 years Premium data relating different locations. at Regular Intervals Locations are reshuffled among the regions. I have calculated the growth as shown in the Pivot table. But I want to calculate the growth in a different way. That is I want to calculate the growth for a particular year say 2015 based on the premium of same loaction of year 2014. In other words realocation of locations to region sholud be disregarded.
Eg:
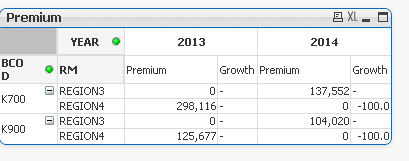
In the above example a new column should be created to show premium for year 2013 disregarding the region of the loaction. In other words premium should be shown for the location where there is zero values in 2013. Then growth should be calculated based on the premium of new coloumn.
Pls help me to do this
- « Previous Replies
-
- 1
- 2
- Next Replies »
- Mark as New
- Bookmark
- Subscribe
- Mute
- Subscribe to RSS Feed
- Permalink
- Report Inappropriate Content
In the above example a new column should be created to show premium for year 2013 disregarding the region of the loaction. In other words premium should be shown for the location where there is zero values in 2013. Then growth should be calculated based on the premium of new coloumn.
Pls help me to do this
Premium for 2013? What values are you expecting to see for 2013 premium
- Mark as New
- Bookmark
- Subscribe
- Mute
- Subscribe to RSS Feed
- Permalink
- Report Inappropriate Content
Dear Sunny,
The values for the zero locations are shown against a different regions. I want to pick such vales and show in new column
- Mark as New
- Bookmark
- Subscribe
- Mute
- Subscribe to RSS Feed
- Permalink
- Report Inappropriate Content
Zero locations are shown against a different regions? I have no idea what that means 
- Mark as New
- Bookmark
- Subscribe
- Mute
- Subscribe to RSS Feed
- Permalink
- Report Inappropriate Content
Sorry
New column should be for 2014 not for 2013
- Mark as New
- Bookmark
- Subscribe
- Mute
- Subscribe to RSS Feed
- Permalink
- Report Inappropriate Content
With what values?
- Mark as New
- Bookmark
- Subscribe
- Mute
- Subscribe to RSS Feed
- Permalink
- Report Inappropriate Content
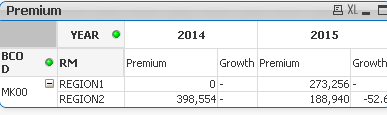
For Example MK00 location (BCOD) is attached to REGION 2 IN 2014 where as in 2015 it is under Region one
- Mark as New
- Bookmark
- Subscribe
- Mute
- Subscribe to RSS Feed
- Permalink
- Report Inappropriate Content
Sunny
in some locations values are not there due to the fact that I am showing sample data. But I think loaction MK03 is a classic example.
- Mark as New
- Bookmark
- Subscribe
- Mute
- Subscribe to RSS Feed
- Permalink
- Report Inappropriate Content
So, this is needed only for 2014 or all the years?
- Mark as New
- Bookmark
- Subscribe
- Mute
- Subscribe to RSS Feed
- Permalink
- Report Inappropriate Content
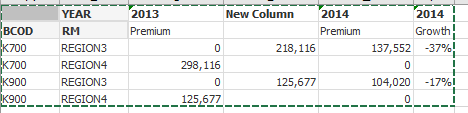
new Column and growth should be shown like below
- « Previous Replies
-
- 1
- 2
- Next Replies »