Unlock a world of possibilities! Login now and discover the exclusive benefits awaiting you.
- Qlik Community
- :
- All Forums
- :
- QlikView App Dev
- :
- Can I change the Symbol for a Single Value on a Sc...
- Subscribe to RSS Feed
- Mark Topic as New
- Mark Topic as Read
- Float this Topic for Current User
- Bookmark
- Subscribe
- Mute
- Printer Friendly Page
- Mark as New
- Bookmark
- Subscribe
- Mute
- Subscribe to RSS Feed
- Permalink
- Report Inappropriate Content
Can I change the Symbol for a Single Value on a Scatter Chart
My scatter chart plots out some values across a date dimension.
My requirement is for today's date to be a big red square. Mainly because they could easily do this in Excel.
I have a scatter chart working. I also have some other harder stuff working, but this part is driving me crazy.
Am I missing something obvious?
Any help is appreciated.
- Tags:
- new_to_qlikview
- Mark as New
- Bookmark
- Subscribe
- Mute
- Subscribe to RSS Feed
- Permalink
- Report Inappropriate Content
Hi, I don't think you can change the symbol, but you can change the color to red:
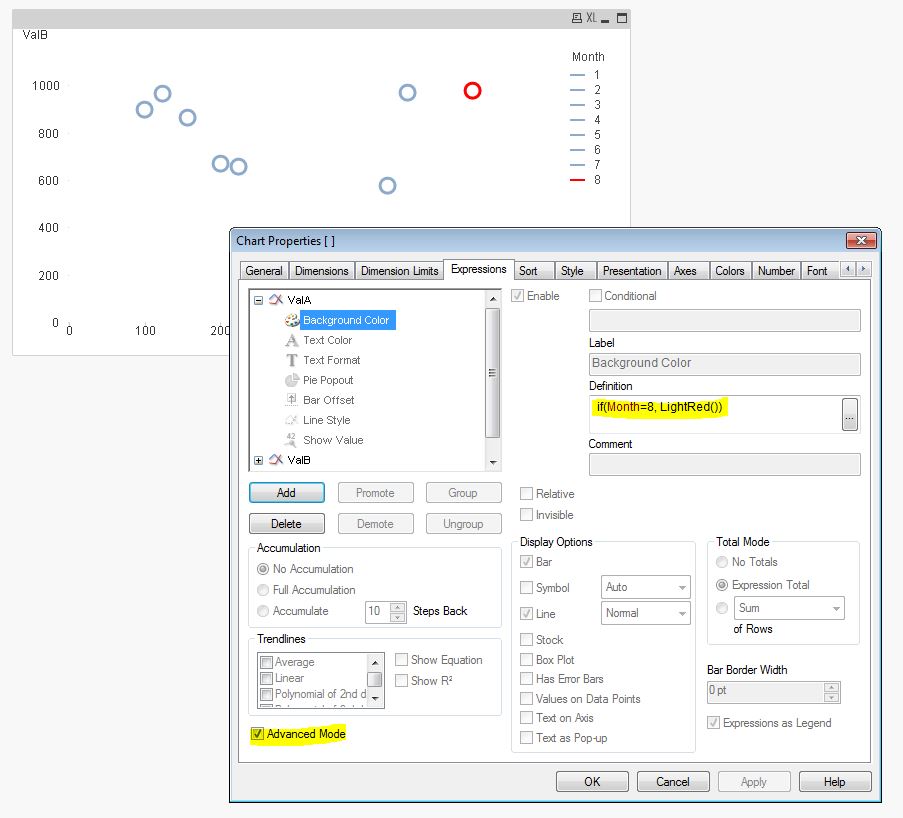
hope that helps
- Mark as New
- Bookmark
- Subscribe
- Mute
- Subscribe to RSS Feed
- Permalink
- Report Inappropriate Content
Thanks, that is helpful. I learned all about that advanced mode check box yesterday. I hadn't really messed iwth the colors, because I knew I could do that. I think between this and messing with the size of the bubble I will get close. Thanks.