Unlock a world of possibilities! Login now and discover the exclusive benefits awaiting you.
- Qlik Community
- :
- All Forums
- :
- QlikView App Dev
- :
- Can I use Set Analysis in a bar chart to compare m...
Options
- Subscribe to RSS Feed
- Mark Topic as New
- Mark Topic as Read
- Float this Topic for Current User
- Bookmark
- Subscribe
- Mute
- Printer Friendly Page
Turn on suggestions
Auto-suggest helps you quickly narrow down your search results by suggesting possible matches as you type.
Showing results for
Not applicable
2013-04-11
07:08 AM
- Mark as New
- Bookmark
- Subscribe
- Mute
- Subscribe to RSS Feed
- Permalink
- Report Inappropriate Content
Can I use Set Analysis in a bar chart to compare monthly EBIT with EBIT the same month previous year?
Hi,
I am trying to make a bar chart that for each month shows that month's EBIT, the budgeted EBIT plus EBIT of the same month a year ago (i.e. 3 bars side-by-side for each month). Right now I am trying to do this with set analysis, using an expression similar to:
sum( {$<Year = {$(=Only(Year)-1)}>} EBIT )
The product is this:
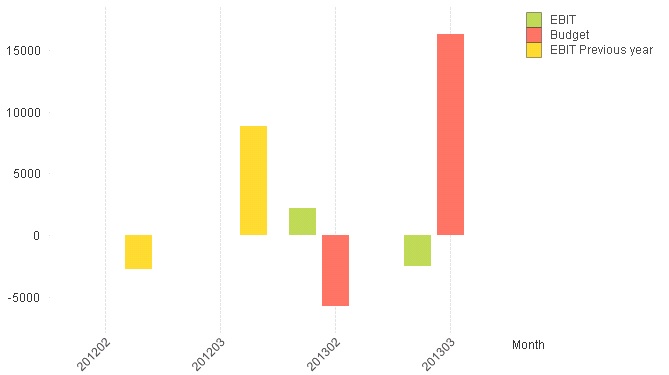
Is there some way I can show the "EBIT Previous year" bars side-by-side with the EBIT and budget bars, i.e. making them appear at 201302/201303 instead of 201202/201203 respectively in his example? If not, how can I solve this otherwise?
Many thanks in advance!
- Tags:
- new_to_qlikview
430 Views
0 Replies