Unlock a world of possibilities! Login now and discover the exclusive benefits awaiting you.
- Qlik Community
- :
- All Forums
- :
- QlikView
- :
- Capability Charts
- Subscribe to RSS Feed
- Mark Topic as New
- Mark Topic as Read
- Float this Topic for Current User
- Bookmark
- Subscribe
- Mute
- Printer Friendly Page
- Mark as New
- Bookmark
- Subscribe
- Mute
- Subscribe to RSS Feed
- Permalink
- Report Inappropriate Content
Capability Charts
Dear Community,
Is there a way to draw capability charts in Qlikivew. Please let me know How can I proceed to do these type of reports.? Please see the attached Image.
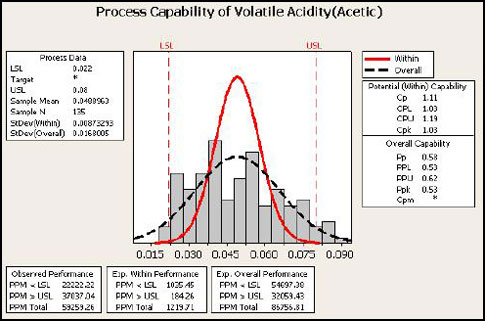
Bars - Histogram
Dashed Black line - Normal Distribution using Over all standard deviation
solid red line - Normal Distribution using Pooled standard deviation
LSL
USL
Please let me know how can we do this?
thanks a ton in advance
Regards
manideep
- Mark as New
- Bookmark
- Subscribe
- Mute
- Subscribe to RSS Feed
- Permalink
- Report Inappropriate Content
- Mark as New
- Bookmark
- Subscribe
- Mute
- Subscribe to RSS Feed
- Permalink
- Report Inappropriate Content
Hi
Thanks for the Response. It doesn't meet my requirement. Can you please let me know how can we achieve the statistical charts like Capability Charts in Qlikview. and also please let me know how can we draw vertical Reference Lines.
Regards
Manideep
- Mark as New
- Bookmark
- Subscribe
- Mute
- Subscribe to RSS Feed
- Permalink
- Report Inappropriate Content
Can anyone Please give an idea on this?
- Mark as New
- Bookmark
- Subscribe
- Mute
- Subscribe to RSS Feed
- Permalink
- Report Inappropriate Content
Hi Manideep,
You need a combo chart. Choose line or bar options for various expressions.
thanks,
Rajesh Vaswani
- Mark as New
- Bookmark
- Subscribe
- Mute
- Subscribe to RSS Feed
- Permalink
- Report Inappropriate Content
PFA sample, More Line add one extra expression make it line.
May this help you.
Vikas
If the issue is solved please mark the answer with Accept as Solution & like it.
If you want to go quickly, go alone. If you want to go far, go together.
- Mark as New
- Bookmark
- Subscribe
- Mute
- Subscribe to RSS Feed
- Permalink
- Report Inappropriate Content
HI Rajesh,
How Can I plot those Vertical Lines for USL and LSL?
- Mark as New
- Bookmark
- Subscribe
- Mute
- Subscribe to RSS Feed
- Permalink
- Report Inappropriate Content
Hi Rajesh,
Thanks for the reply and here my calculation is related to complex Statistical expression. I need to find statistical normal distribution value in Qlikview.