Unlock a world of possibilities! Login now and discover the exclusive benefits awaiting you.
- Qlik Community
- :
- All Forums
- :
- QlikView App Dev
- :
- Categorizing pivot table
- Subscribe to RSS Feed
- Mark Topic as New
- Mark Topic as Read
- Float this Topic for Current User
- Bookmark
- Subscribe
- Mute
- Printer Friendly Page
- Mark as New
- Bookmark
- Subscribe
- Mute
- Subscribe to RSS Feed
- Permalink
- Report Inappropriate Content
Categorizing pivot table
Hi,
I have the following excel data in this format:
| Books | Price |
| A | 15 |
| B | 9 |
| C | 12 |
| D | 11 |
| E | 8 |
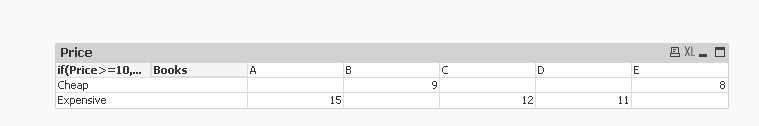
I am able to create a table in qlikview. However, I would like to know if I would be able to further categorize them into 'Expensive'>10, 'Cheap'<10 in Qlikview directly? eventually, I hope to create a pivot table which looks smth like this:
eventually, I hope that in my final pivot table, in order to find how cheap book A is, I would like to click the category 'cheap', followed by 'book A', to find the price of book A.
| Row Labels | A | B | C | D | E | |
| Cheap | 9 | 13 | 22 | |||
| Expensive | 15 | 12 | 8 | 35 |
- Mark as New
- Bookmark
- Subscribe
- Mute
- Subscribe to RSS Feed
- Permalink
- Report Inappropriate Content
Create buckets
- Mark as New
- Bookmark
- Subscribe
- Mute
- Subscribe to RSS Feed
- Permalink
- Report Inappropriate Content
Dimension:
=if(Price>=10,'Expensive','Cheap')
=Books
Expression:
Price
- Mark as New
- Bookmark
- Subscribe
- Mute
- Subscribe to RSS Feed
- Permalink
- Report Inappropriate Content
- Mark as New
- Bookmark
- Subscribe
- Mute
- Subscribe to RSS Feed
- Permalink
- Report Inappropriate Content
Hi Try This,
T1:
load * Inline [
Books, Price
A, 15
B, 9
C, 12
D, 11
E, 8
];
NoConcatenate
T2:
load
Books,
Price,
if(Price>10,'Expensive','Cheap') as Final
Resident T1;
drop table T1;
- Mark as New
- Bookmark
- Subscribe
- Mute
- Subscribe to RSS Feed
- Permalink
- Report Inappropriate Content
HI, thanks for replying, there seems to be an error.
i am supposed to type the above code in the script editor as follows right?
Load books,
Dimension:
=if(Price>=10,'Expensive','Cheap')
=Books
Expression:
Price
I will get an error.
- Mark as New
- Bookmark
- Subscribe
- Mute
- Subscribe to RSS Feed
- Permalink
- Report Inappropriate Content
hi, thanks for replying. but i will get an unknown statement error.
Also, i will be dealing with big data, so i would not be able to key in t1. how should the code in this case then?
- Mark as New
- Bookmark
- Subscribe
- Mute
- Subscribe to RSS Feed
- Permalink
- Report Inappropriate Content
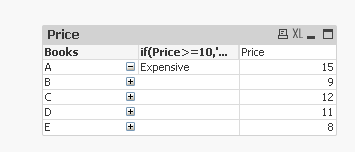
it is something like this table though, just that books should be the second column, and the first column would be the if statement. 