Unlock a world of possibilities! Login now and discover the exclusive benefits awaiting you.
- Qlik Community
- :
- All Forums
- :
- QlikView App Dev
- :
- Change column color if greater than average
- Subscribe to RSS Feed
- Mark Topic as New
- Mark Topic as Read
- Float this Topic for Current User
- Bookmark
- Subscribe
- Mute
- Printer Friendly Page
- Mark as New
- Bookmark
- Subscribe
- Mute
- Subscribe to RSS Feed
- Permalink
- Report Inappropriate Content
Change column color if greater than average
Hi Masters!
I am trying to change the colors of the columns that are 50% greater than average. However, it is working only for the weekly analysis.
For the monthly analysis (below) it seems the formula is not working
- Monthly analysis:
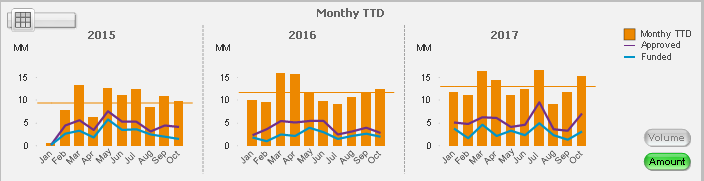
Background Color formula:
if(if(%pickmetric = 'Volume', count($(=%metric)))>$(=avg(aggr(count($(=%metric)),Year,Month))*1.5),rgb(255,0,0),if(if(%pickmetric = 'Amount', sum($(=%metric)))>$(=avg(aggr(sum($(=%metric)),Year,Month))*1.5),rgb(255,0,0)))
- Weekly analysis:
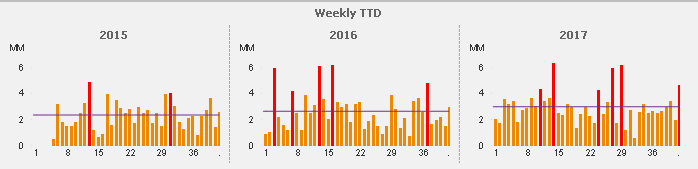
Background Color formula:
if(if(%pickmetric = 'Volume', count($(=%metric)))>$(=avg(aggr(count($(=%metric)),Year,Week))*1.5),rgb(255,0,0),if(if(%pickmetric = 'Amount', sum($(=%metric)))>$(=avg(aggr(sum($(=%metric)),Year,Week))*1.5),rgb(255,0,0)))
- Filters:

- Dimensions:
Year
Month
Does anyone know why it is not working for the Monthly analysis?
Thanks
Felipe
Accepted Solutions
- Mark as New
- Bookmark
- Subscribe
- Mute
- Subscribe to RSS Feed
- Permalink
- Report Inappropriate Content
There is un necessary parenthesis closed, Could be the reason from there? Will you able to attach application
- Mark as New
- Bookmark
- Subscribe
- Mute
- Subscribe to RSS Feed
- Permalink
- Report Inappropriate Content
Can you provide sample app?
- Mark as New
- Bookmark
- Subscribe
- Mute
- Subscribe to RSS Feed
- Permalink
- Report Inappropriate Content
There is un necessary parenthesis closed, Could be the reason from there? Will you able to attach application
- Mark as New
- Bookmark
- Subscribe
- Mute
- Subscribe to RSS Feed
- Permalink
- Report Inappropriate Content
Hi,
Which one is 50% greater than the average?