Unlock a world of possibilities! Login now and discover the exclusive benefits awaiting you.
- Qlik Community
- :
- All Forums
- :
- QlikView App Dev
- :
- Change the color of a Bar based on an expression
- Subscribe to RSS Feed
- Mark Topic as New
- Mark Topic as Read
- Float this Topic for Current User
- Bookmark
- Subscribe
- Mute
- Printer Friendly Page
- Mark as New
- Bookmark
- Subscribe
- Mute
- Subscribe to RSS Feed
- Permalink
- Report Inappropriate Content
Change the color of a Bar based on an expression
Hi Everyone, I'm traying to change the color of a bar in a bar chart to RED Based on this expression but I keep getting the 'error in expression' message. Can anyone tell me what I'm doing wrong?
Thanks!
George
= (Sum (AMOUNT_AT_RISK_USD) - Sum (AMOUNT_PREVENTED_USD) - Sum (AMOUNT_RECOVERED_USD))>0, RED())
- Mark as New
- Bookmark
- Subscribe
- Mute
- Subscribe to RSS Feed
- Permalink
- Report Inappropriate Content
Sunny - this is a continuation of the issue above. I think I'm missing something.......... in the screen print below you can see that I've got the colors working the way I want them..........the problem now is the presentation. Everything is grouped on the Country, How do I get separate bars for the Amount at Risk, Prevented/Recovered and Total Loss..........grouped by country. I would be looking at a possible 3 bars per country??? Take Hungary for example, I'ld like to see the Blue, Green and Red bars side by side. Is that an additional dimension?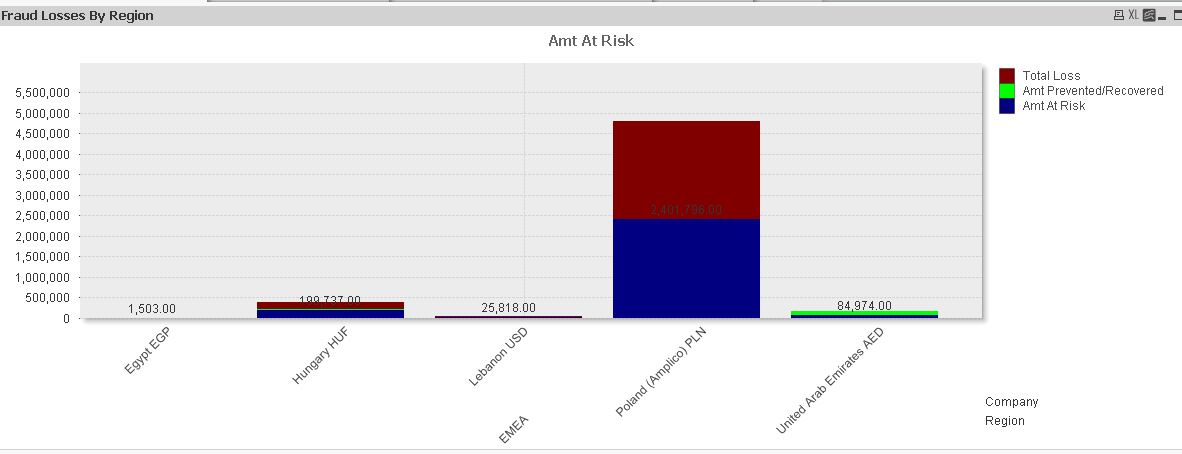
- Mark as New
- Bookmark
- Subscribe
- Mute
- Subscribe to RSS Feed
- Permalink
- Report Inappropriate Content
Do you multiple dimensions and multiple expressions in your application? I think you will need to change somethings around to make this work. Would it be possible to share a sample?
- Mark as New
- Bookmark
- Subscribe
- Mute
- Subscribe to RSS Feed
- Permalink
- Report Inappropriate Content
May be try this
Chart Properties -> Style Tab -> Check Grouped rather than Stacked.
- Mark as New
- Bookmark
- Subscribe
- Mute
- Subscribe to RSS Feed
- Permalink
- Report Inappropriate Content
Tried that first.......didn't work. thanks!!
- Mark as New
- Bookmark
- Subscribe
- Mute
- Subscribe to RSS Feed
- Permalink
- Report Inappropriate Content
Here is a sample of what I'm doing? Yes, two dimensions, Region and Country.
- Mark as New
- Bookmark
- Subscribe
- Mute
- Subscribe to RSS Feed
- Permalink
- Report Inappropriate Content
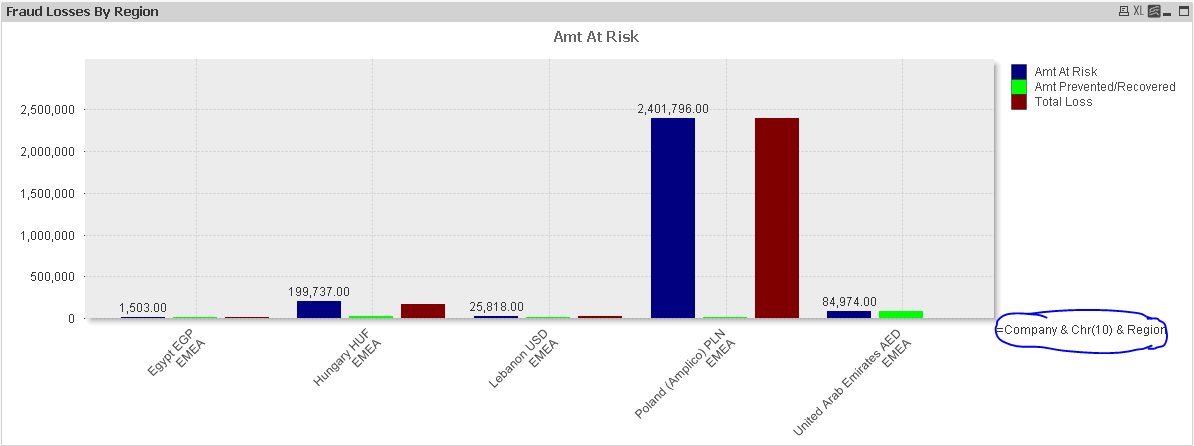
Will something like this work for you?
- Mark as New
- Bookmark
- Subscribe
- Mute
- Subscribe to RSS Feed
- Permalink
- Report Inappropriate Content
Yes, that would work. I see your expression on the Axis, where would you enter that??
- Mark as New
- Bookmark
- Subscribe
- Mute
- Subscribe to RSS Feed
- Permalink
- Report Inappropriate Content
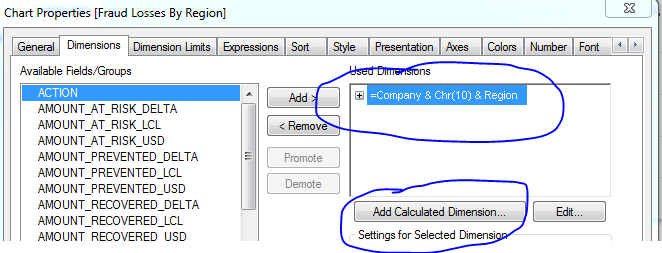
If you open the application I have attached you would see that I replaced you two dimensions with a single dimension. Do that will be added as your dimension
- Mark as New
- Bookmark
- Subscribe
- Mute
- Subscribe to RSS Feed
- Permalink
- Report Inappropriate Content
What is the Chr function representing here?
- Mark as New
- Bookmark
- Subscribe
- Mute
- Subscribe to RSS Feed
- Permalink
- Report Inappropriate Content
Line break... basically pushes Region and Country in two different rows.