Unlock a world of possibilities! Login now and discover the exclusive benefits awaiting you.
Announcements
April 13–15 - Dare to Unleash a New Professional You at Qlik Connect 2026: Register Now!
- Qlik Community
- :
- All Forums
- :
- QlikView App Dev
- :
- Chart Design
Options
- Subscribe to RSS Feed
- Mark Topic as New
- Mark Topic as Read
- Float this Topic for Current User
- Bookmark
- Subscribe
- Mute
- Printer Friendly Page
Turn on suggestions
Auto-suggest helps you quickly narrow down your search results by suggesting possible matches as you type.
Showing results for
Creator
2013-10-25
10:08 AM
- Mark as New
- Bookmark
- Subscribe
- Mute
- Subscribe to RSS Feed
- Permalink
- Report Inappropriate Content
Chart Design
Hi all,
i have one pivot table...with 3 dimensions and 10 metrics.
i want to display 1st 5 metrics under one header...6,7 metrics under one Header...and last 3 metrics under One Header...
is it possible....if it is help me....
Thanks in advance!!!!
Smiley
- Tags:
- chart
414 Views
2 Replies
Partner - Champion III
2013-10-25
11:31 AM
- Mark as New
- Bookmark
- Subscribe
- Mute
- Subscribe to RSS Feed
- Permalink
- Report Inappropriate Content
The easiest way is to use text boxes as headers. See attached example
talk is cheap, supply exceeds demand
320 Views
Creator III
2013-10-25
11:32 AM
- Mark as New
- Bookmark
- Subscribe
- Mute
- Subscribe to RSS Feed
- Permalink
- Report Inappropriate Content
Hi,
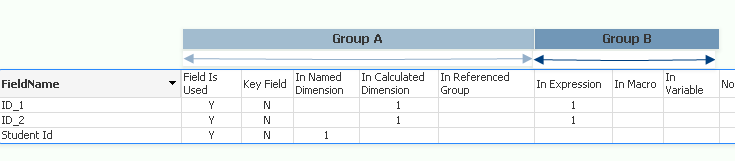
I wanted to do something similar and could not find anything in the chart properties itself, so resorted to using text boxes and arrows to indicate groupings as shown in the example below. I also removed the Caption from the chart so that I could move the other objects closer to the actual chart headings.
Azam
320 Views