Unlock a world of possibilities! Login now and discover the exclusive benefits awaiting you.
- Qlik Community
- :
- All Forums
- :
- QlikView App Dev
- :
- Chart - Display Properties
- Subscribe to RSS Feed
- Mark Topic as New
- Mark Topic as Read
- Float this Topic for Current User
- Bookmark
- Subscribe
- Mute
- Printer Friendly Page
- Mark as New
- Bookmark
- Subscribe
- Mute
- Subscribe to RSS Feed
- Permalink
- Report Inappropriate Content
Chart - Display Properties
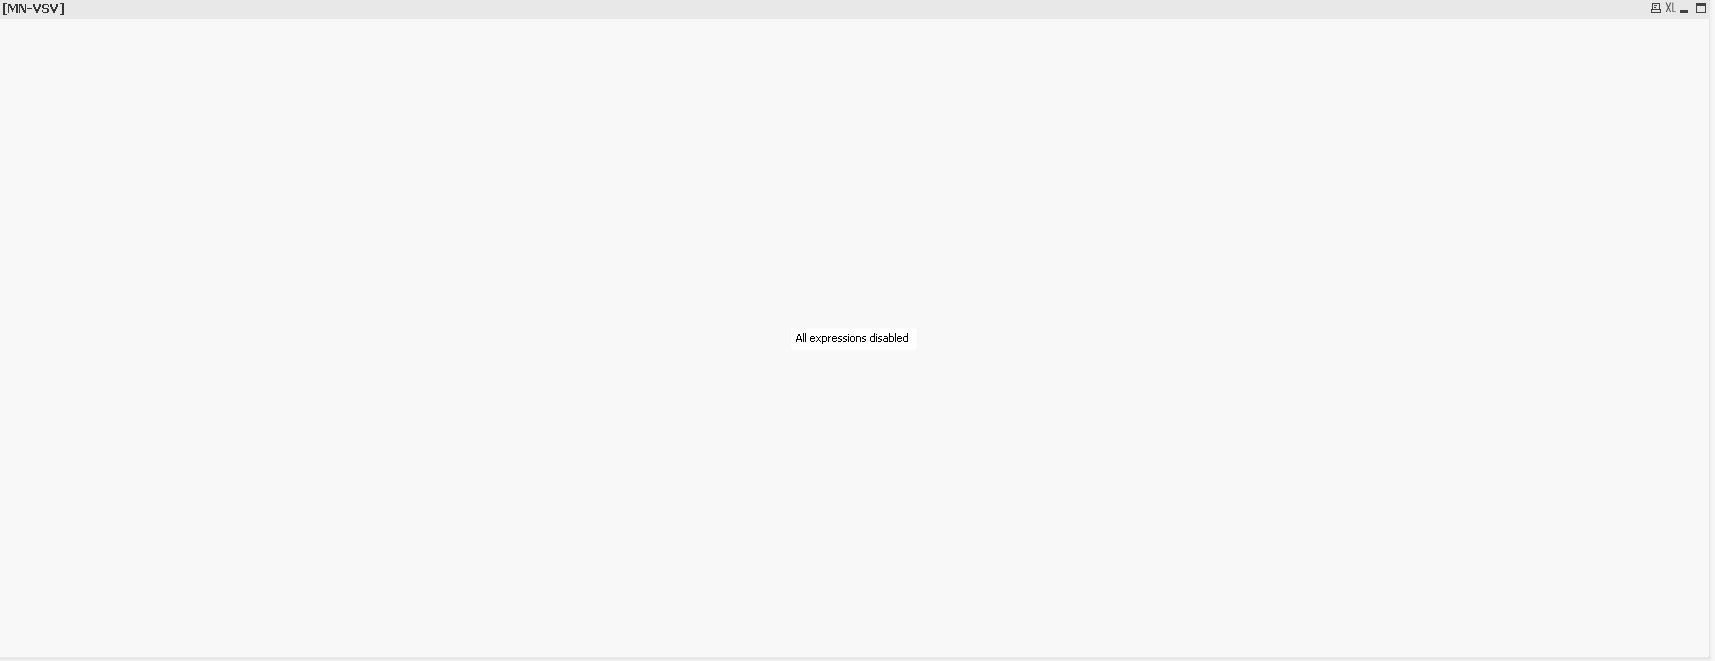
While plotting a line chart, I have added a condition on expression. So when condition is not satisfied, nothing is displayed on line chart. Just a message is displayed stating "All Expressions Disabled". Is it possible to display empty chart (with empty grids) instead of blank chart?
Following is what I see when condition is not satisfied:
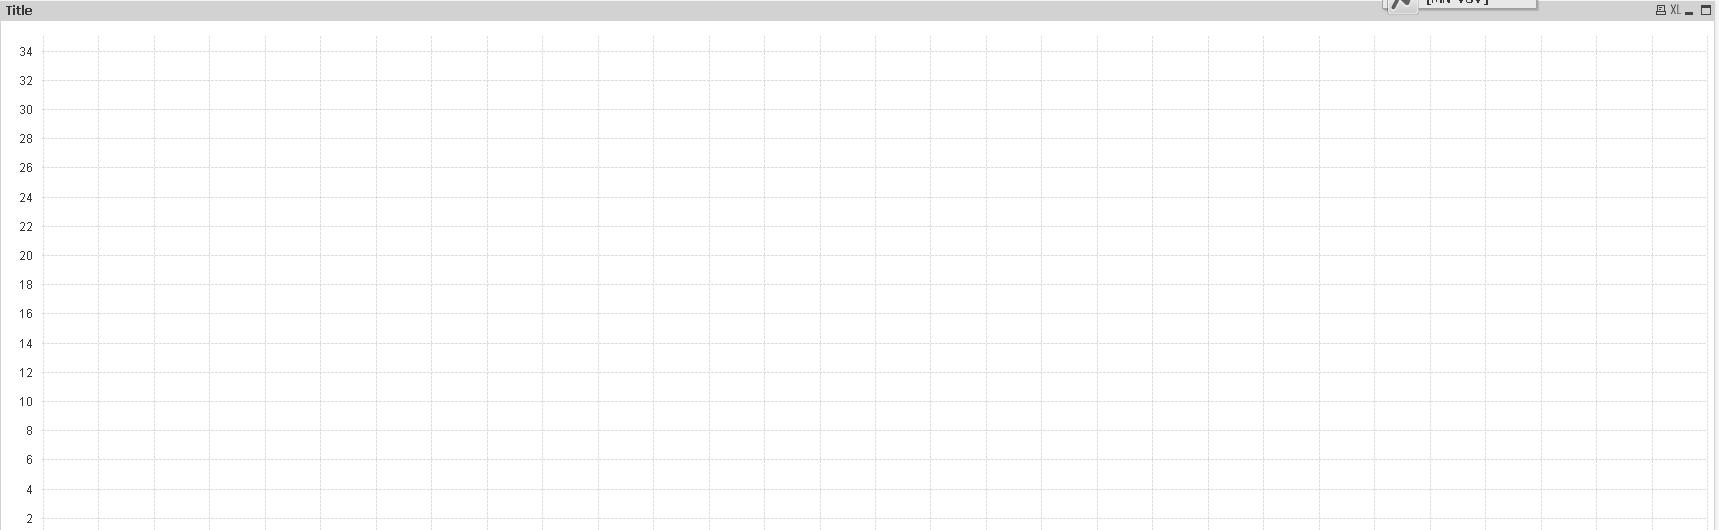
It would be nice if I get something like this:
- Tags:
- new_to_qlikview
- Mark as New
- Bookmark
- Subscribe
- Mute
- Subscribe to RSS Feed
- Permalink
- Report Inappropriate Content
You can try this instead of put a condition to display your expression.
In your expression, you can put this :
If (condition, your expression, 0)
- Mark as New
- Bookmark
- Subscribe
- Mute
- Subscribe to RSS Feed
- Permalink
- Report Inappropriate Content
Hey,
you can add one more expression with a dummy value(like =1) and always hide this expression in chart. This should do.
BR,
Chinna