Unlock a world of possibilities! Login now and discover the exclusive benefits awaiting you.
Announcements
FLASH SALE: Save $500! Use code FLASH2026 at checkout until Feb 14th at 11:59PM ET. Register Now!
- Qlik Community
- :
- All Forums
- :
- QlikView App Dev
- :
- Chart Expression show
Options
- Subscribe to RSS Feed
- Mark Topic as New
- Mark Topic as Read
- Float this Topic for Current User
- Bookmark
- Subscribe
- Mute
- Printer Friendly Page
Turn on suggestions
Auto-suggest helps you quickly narrow down your search results by suggesting possible matches as you type.
Showing results for
Creator II
2012-11-16
06:59 AM
- Mark as New
- Bookmark
- Subscribe
- Mute
- Subscribe to RSS Feed
- Permalink
- Report Inappropriate Content
Chart Expression show
İn my chart ,
I have two expression
one of them is quantity of request opening date more than 30 days : =Count({<ISTEK_ACISTARIHI2 = {"<=$(=Timestamp(Today() - 30, 'DD.MM.YYYY hh:mm:ss'))"},ISTEK_DURUM={'Açık'}>} ISTEK_ACISTARIHI2) 1 aydan uzun süredir Açık İstek Adedi
other expression is only quantity of requests : count(IF(ISTEK_DURUM='Açık',ISTEK_DURUM)) Açık İstek Adedi
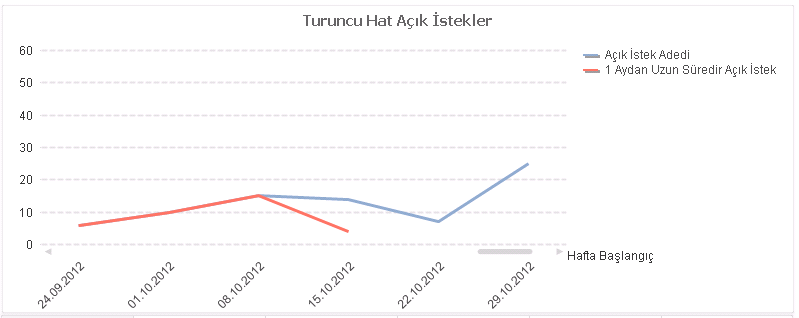
but in chart "açık istek adedi" (Blue one)expression is shown for only 30 days How can I make it show through all dates like red expression
344 Views
1 Reply
Creator II
2012-11-16
07:25 AM
Author
- Mark as New
- Bookmark
- Subscribe
- Mute
- Subscribe to RSS Feed
- Permalink
- Report Inappropriate Content
These two expressions are overlaped so I can not see one of them
244 Views