Unlock a world of possibilities! Login now and discover the exclusive benefits awaiting you.
- Qlik Community
- :
- All Forums
- :
- QlikView App Dev
- :
- Chart - Legend Issue
- Subscribe to RSS Feed
- Mark Topic as New
- Mark Topic as Read
- Float this Topic for Current User
- Bookmark
- Subscribe
- Mute
- Printer Friendly Page
- Mark as New
- Bookmark
- Subscribe
- Mute
- Subscribe to RSS Feed
- Permalink
- Report Inappropriate Content
Chart - Legend Issue
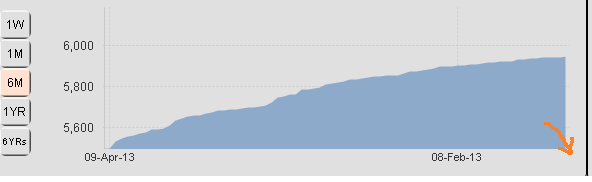
Please find the screenshot,
Is there any way to enforce a legend at the last point of primary dimension? I don't want vertical legend. Here I am trying to show 180 data points, and all of them can't be shown as legend, qv manages the frequency of legends.
Thanks.
- Mark as New
- Bookmark
- Subscribe
- Mute
- Subscribe to RSS Feed
- Permalink
- Report Inappropriate Content
Hi,
create a textbox within chart using chart props --> Presentation Tab --> Add...
expression is like
=MaxString(MyPrimDim)
To move the little textbox next to the corner hold <ctrl>+<shift> and fetch it with the mouse-cursor
HtH
Roland
Try different sizings of your chart because the scaling and positioning of the text is't always correct.
- Mark as New
- Bookmark
- Subscribe
- Mute
- Subscribe to RSS Feed
- Permalink
- Report Inappropriate Content
Thank you for your reply. This alternative solution i can't use, because my chart dimension limi varies with button click, and for 1week data the values comes fine at the end and then it will get overlapped with the customized text. i am looking for inbuilt feature, if any.
- Mark as New
- Bookmark
- Subscribe
- Mute
- Subscribe to RSS Feed
- Permalink
- Report Inappropriate Content
Ok,
I know this was (is) a workaround and I will wait with you for another solution.
Meanwhile try sth similar to this:
=if(GetPossibleCount(MyDim) > 9,MaxString(MyDim), '')
RR
Note
The '' (two single qoutes) as you do not want a '-' (dash) when showing a Null-String.
- Mark as New
- Bookmark
- Subscribe
- Mute
- Subscribe to RSS Feed
- Permalink
- Report Inappropriate Content
On button click i set variable value, and this variable is used in the set analysis part of the expression, hence the GetPossibleCount() returns always a statis number, however by tweaking a bit of your expression (used the variable in if condition), i get another alternative.
Thanks for your shedding.