Unlock a world of possibilities! Login now and discover the exclusive benefits awaiting you.
- Qlik Community
- :
- All Forums
- :
- QlikView App Dev
- :
- Chart label modification
- Subscribe to RSS Feed
- Mark Topic as New
- Mark Topic as Read
- Float this Topic for Current User
- Bookmark
- Subscribe
- Mute
- Printer Friendly Page
- Mark as New
- Bookmark
- Subscribe
- Mute
- Subscribe to RSS Feed
- Permalink
- Report Inappropriate Content
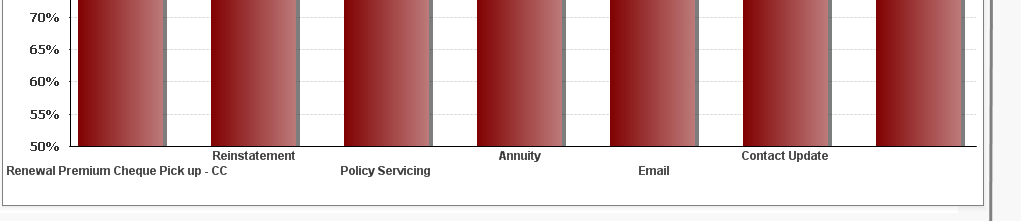
Chart label modification
hi,
I need to fit the labels below bar chart shown in figure, for example on 1st bar (Renewal Premium Cheque Pick up-cc ) i need to adjust it as
Renewal Premium
Cheque Pick up-cc one below another .??
- « Previous Replies
-
- 1
- 2
- Next Replies »
- Mark as New
- Bookmark
- Subscribe
- Mute
- Subscribe to RSS Feed
- Permalink
- Report Inappropriate Content
Hi.
Select the chart then press and hold Ctrl+Shift.
Now the red boarders are shown and you can move the objects within the chart.
- Mark as New
- Bookmark
- Subscribe
- Mute
- Subscribe to RSS Feed
- Permalink
- Report Inappropriate Content
Whiteline has told you the option just play with it
- Mark as New
- Bookmark
- Subscribe
- Mute
- Subscribe to RSS Feed
- Permalink
- Report Inappropriate Content
Hi,
you can also change the orientation of the chart.. for the label's having lengthy names .. it is preferable to make the chart in horizontal way..
you can change the chart orientation from style tab of chart properties.
HTH
Sushil
- Mark as New
- Bookmark
- Subscribe
- Mute
- Subscribe to RSS Feed
- Permalink
- Report Inappropriate Content
hi whiteline i tried press and hold Ctrl+Shift. option but unable to get
Renewal Premium
Cheque Pick up-cc in
- Mark as New
- Bookmark
- Subscribe
- Mute
- Subscribe to RSS Feed
- Permalink
- Report Inappropriate Content
can post sample application
- Mark as New
- Bookmark
- Subscribe
- Mute
- Subscribe to RSS Feed
- Permalink
- Report Inappropriate Content
You want your labels to split multiline. You can only display multiline labels when you select the diagonal format "/" on the Axes property pane. And you must split them into multi line yourself. It's easiest to do this in the script.
See this post for how to split them in the script.
Displaying long labels on chart X-axis
-Rob
- Mark as New
- Bookmark
- Subscribe
- Mute
- Subscribe to RSS Feed
- Permalink
- Report Inappropriate Content
Sorry, not noticed that it's a chart label not the floating text.
Look at the solution Rob's posted below.
- Mark as New
- Bookmark
- Subscribe
- Mute
- Subscribe to RSS Feed
- Permalink
- Report Inappropriate Content
Hi,
You can't split labels in multiple line horizontally, however if you have fix category or want to show top 5 label you can use FirstSortedValue() function to calculate label and use "Text in Chart" option to show on chart. Please Note, you have to align these labels properly on the chart and unchecked show legend option to make it real bar chart.
Below chart shows top 3 constraint plan in horizontal multiline.
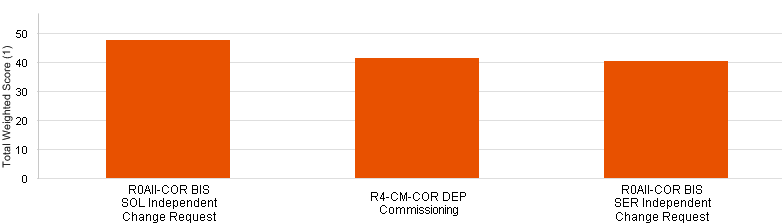
Thanks
- Mark as New
- Bookmark
- Subscribe
- Mute
- Subscribe to RSS Feed
- Permalink
- Report Inappropriate Content
Can you attach a sample QVW that demonstrates this?
-Rob
- « Previous Replies
-
- 1
- 2
- Next Replies »