Unlock a world of possibilities! Login now and discover the exclusive benefits awaiting you.
- Qlik Community
- :
- All Forums
- :
- QlikView App Dev
- :
- Chart showing variances of Receivables value betwe...
- Subscribe to RSS Feed
- Mark Topic as New
- Mark Topic as Read
- Float this Topic for Current User
- Bookmark
- Subscribe
- Mute
- Printer Friendly Page
- Mark as New
- Bookmark
- Subscribe
- Mute
- Subscribe to RSS Feed
- Permalink
- Report Inappropriate Content
Chart showing variances of Receivables value between two report dates
Hi,
I would appreciate your help in the following issue.
I have a database showing open receivables for quite a number of dimensions, report date is one of them. I would like to create a variance chart showing me the open receivables balances for two chosen report dates and the variance for a created group of dimensions between those balances. Something like attached excel (I put there variance only for customers dimension, but the idea is there - I change Date1 or Date2, my chart shows the variance between the Dates selected).
WHAT I KNOW:
To have such a chart I need to have 3 dimensions in Chart Properties/Expressions: The one defining DATE1, the one defining VARIANCE and the one defining DATE2. In the VARIANCE dimension I need to define "Bar Offset" property so that I could get correct bars.
WHAT I DO NOT KNOW:
Majour unknown is a proper definition of DATE1, DATE2 dimensions - as I mentioned one of my DB dimensions is "Report date". I would like the DATE1, DATE2 were defined in the following way: If user chooses range of dates from "Report date", then the minimum date of such range is DATE1 (so DATE 1 shows receivables balance for minimum date chosen by user in its range), the maximum is DATE2. If user changes only one value from "Report date" then 31 Dec of the previous year to the one chosen is DATE 1, the selection is DATE2. If used does not make any solection in "Report date", then chart is not displayed (could be some message instead, but this is more a cosmetics)
VARIANCE - how to correctly define this dimension to show variances for created by me cyclical group call it REC_VAR that I want to place as dimension of this chart.
I would appreciate any help regarding this issue. I have not done such advanced things for some time, so my know-how in such matters is based on imitating the similar examples to the problems I do face.
Count on you...
Robert
- Mark as New
- Bookmark
- Subscribe
- Mute
- Subscribe to RSS Feed
- Permalink
- Report Inappropriate Content
I am out of the office until 07/07/2011.
Retorno na 5a feira a noite.
Se for urgente, por favor me contacte no celular.
Note: This is an automated response to your message "[QlikView Developers
Group] - Re: Chart showing variances of Receivables value between two
report dates" sent on 6/7/11 3:57:31 AM.
This is the only notification you will receive while this person is away.
- Mark as New
- Bookmark
- Subscribe
- Mute
- Subscribe to RSS Feed
- Permalink
- Report Inappropriate Content
I am out of the office until 07/07/2011.
Retorno na 5a feira a noite.
Se for urgente, por favor me contacte no celular.
Note: This is an automated response to your message "[QlikView Developers
Group] - Re: Chart showing variances of Receivables value between two
report dates" sent on 6/7/11 3:43:58 AM.
This is the only notification you will receive while this person is away.
- Mark as New
- Bookmark
- Subscribe
- Mute
- Subscribe to RSS Feed
- Permalink
- Report Inappropriate Content
Here is a working example of using actions on text boxes to modify dates.
Hope it is helpful.
Steve
- Mark as New
- Bookmark
- Subscribe
- Mute
- Subscribe to RSS Feed
- Permalink
- Report Inappropriate Content
I am out of the office until 07/07/2011.
Retorno na 5a feira a noite.
Se for urgente, por favor me contacte no celular.
Note: This is an automated response to your message "[QlikView Developers
Group] - Re: Chart showing variances of Receivables value between two
report dates" sent on 6/7/11 5:53:30 PM.
This is the only notification you will receive while this person is away.
- Mark as New
- Bookmark
- Subscribe
- Mute
- Subscribe to RSS Feed
- Permalink
- Report Inappropriate Content
Hi Steve,
Thanks a lot for this example... I will go through it after work. Visually it does look better than the one I have now...
- Mark as New
- Bookmark
- Subscribe
- Mute
- Subscribe to RSS Feed
- Permalink
- Report Inappropriate Content
Hi,
Thanks a lot. Looks good. I will check this out
- Mark as New
- Bookmark
- Subscribe
- Mute
- Subscribe to RSS Feed
- Permalink
- Report Inappropriate Content
Hi Steve,
Very helpful file for me, thanks. I did not explore the "Set Variable" external action type in the text box...
One more question. The logic you showed will work perfectly if the DATE variable you want to impact does have the complete range of dates.
In my case, we do not load receivables every day, but 2, 3 times a week, so I miss some dates in my DATE variable(which shows the date of receivables information, equaling the date of transfering the data from transactional system to DB linked with QV). So what I need the "day button" to do, is to move me from currently selected date to the previous one present in DATE variable (tody is July 14, if last receivables were loaded on 10 July, then "day button" will show 10 July after one click). The month button would then move me to the date from last month closest to the one currently chosen when it comes to the day information (today is 14 July, reports last month around this date were loded at 10 Jun and 12 June and 18 June, so 12 June is chosen after clicking month button once)
Do you have any idea how this could be done?
//Robert
- Mark as New
- Bookmark
- Subscribe
- Mute
- Subscribe to RSS Feed
- Permalink
- Report Inappropriate Content
You will need to use a bit of Set Analysis to work out the next day in the direction you are headed on which there is a value. Assuming you have a field called DateField and your variables are as per your document for the previous day it will be something like:
=date(max({1<DateField={'<=$(=date(DATE1 -1, '$(vDateFormat)'))'}>}DateField), '$(vDateFormat)')
And the prior month will be:
=date(max({1<DateField={'<=$(=date(addmonths(DATE1, -1), '$(vDateFormat)'))'}>}DateField), '$(vDateFormat)')
Next day and next month should be relatively straight forward to work out.
I have seen an issue where QlikView doesn't like having the same variable twice in a single expression - but that seems to have gone in QV10 SR3.
Hope that helps,
Steve
- Mark as New
- Bookmark
- Subscribe
- Mute
- Subscribe to RSS Feed
- Permalink
- Report Inappropriate Content
Hi Steve,
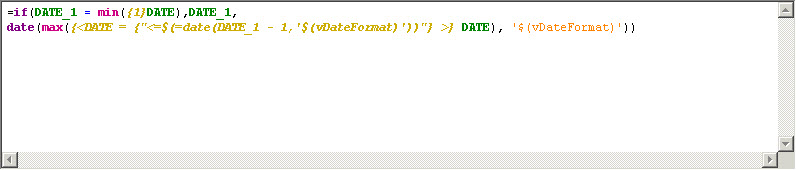
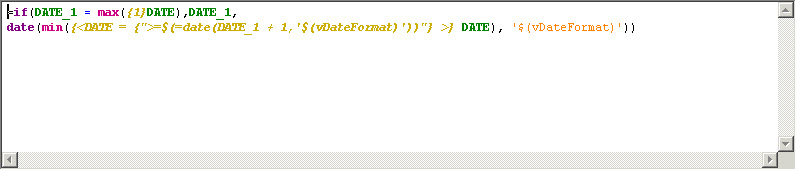
I edited your formulas a little bit and now they work exactly as I wanted them to work. Thanks for sharing the formulas with set analysis. I attach mine, in case someone finds them helpful:
DATE - dimension loaded from transactional DB, containing set of dates from the past with quite some missing
DATE_1 - my own variable changed by << , <, > , >> buttons
<< button formula
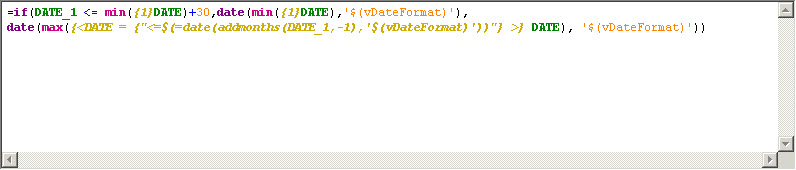
< button formula
>> button formula

> button formula
- Mark as New
- Bookmark
- Subscribe
- Mute
- Subscribe to RSS Feed
- Permalink
- Report Inappropriate Content
Ich werde ab 15.07.2011 nicht im Büro sein. Ich kehre zurück am
08.08.2011.
mit freundlichen Grüßen
Gerhard Schrepfer