Unlock a world of possibilities! Login now and discover the exclusive benefits awaiting you.
- Qlik Community
- :
- All Forums
- :
- QlikView App Dev
- :
- Chart with different Dimensions
- Subscribe to RSS Feed
- Mark Topic as New
- Mark Topic as Read
- Float this Topic for Current User
- Bookmark
- Subscribe
- Mute
- Printer Friendly Page
- Mark as New
- Bookmark
- Subscribe
- Mute
- Subscribe to RSS Feed
- Permalink
- Report Inappropriate Content
Chart with different Dimensions
Hi,
I have a chart with sum(sales) as expression for ex and i have 3 buttons to toggle dimensions for that chart in between 3 different dimensions.
That means, when i select button 1, it should show chart with dimension1 & sum(sales)
when i select button 2, it should show chart with dimension2 & sum(sales)
when i select button 3, it should show chart with dimension3 & sum(sales)
how to get it ?
- Mark as New
- Bookmark
- Subscribe
- Mute
- Subscribe to RSS Feed
- Permalink
- Report Inappropriate Content
 The chart is showing like in the last pic, it is not changing according to the selections
- Mark as New
- Bookmark
- Subscribe
- Mute
- Subscribe to RSS Feed
- Permalink
- Report Inappropriate Content
That I can do, but i need to apply the same logic for almost 20 charts. So, if i create separate charts, the number will increase to 60-80 charts that the client doesn't want..
- Mark as New
- Bookmark
- Subscribe
- Mute
- Subscribe to RSS Feed
- Permalink
- Report Inappropriate Content
..what about the expression?
Do you have one only expression "sum(sales)" ?
- Mark as New
- Bookmark
- Subscribe
- Mute
- Subscribe to RSS Feed
- Permalink
- Report Inappropriate Content
Hi
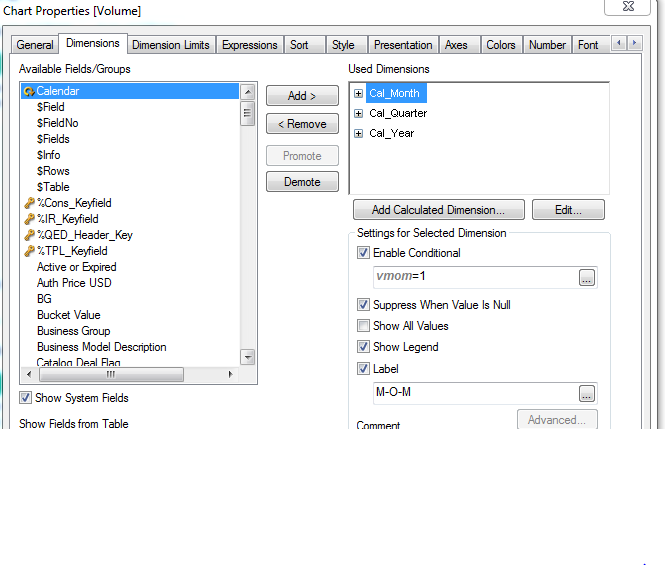
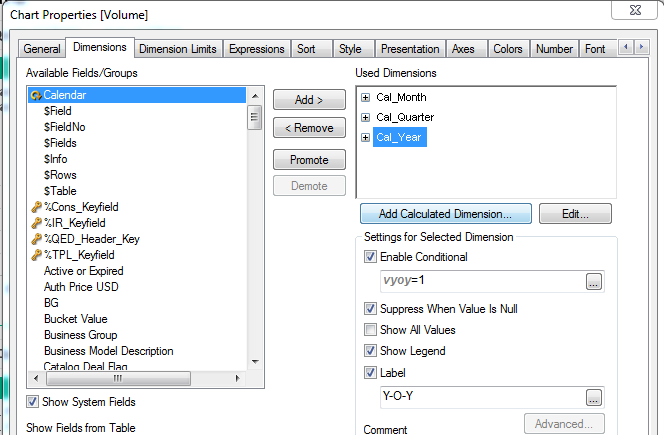
just use one variable for all 3 dimensions
variable=1
variable=2
variable=3
- Mark as New
- Bookmark
- Subscribe
- Mute
- Subscribe to RSS Feed
- Permalink
- Report Inappropriate Content
ok.. so coming back to an unique chart.. you can apply the same condition on the expressions as for the dimensions, 3 dimensions and 3 expressions.. or if it's not strictly necessary to have buttons, instead to use buttons to select the metric (month/quarter/year), you can include the 3 dimensions in a cycle group and use the cycle group as unique dimension and 1 expression.
- Mark as New
- Bookmark
- Subscribe
- Mute
- Subscribe to RSS Feed
- Permalink
- Report Inappropriate Content
Okay, thanks for suggestions.
- Mark as New
- Bookmark
- Subscribe
- Mute
- Subscribe to RSS Feed
- Permalink
- Report Inappropriate Content
hi
I have created you an example to show.
Hope this helps.
Thanks,
james.
- Mark as New
- Bookmark
- Subscribe
- Mute
- Subscribe to RSS Feed
- Permalink
- Report Inappropriate Content
You will surely get by using container object.
Try that,
- Mark as New
- Bookmark
- Subscribe
- Mute
- Subscribe to RSS Feed
- Permalink
- Report Inappropriate Content
have a look at the attached sample.
hope this helps
- Mark as New
- Bookmark
- Subscribe
- Mute
- Subscribe to RSS Feed
- Permalink
- Report Inappropriate Content
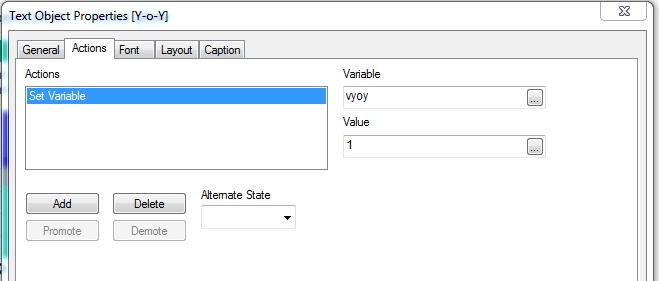
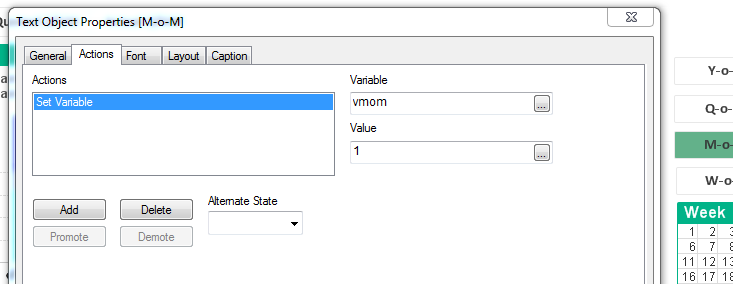
You probably might have click all the text boxes, all the variables have become 1. Best to use one variable 'vDim'
and use them as 1, 2 or 3 for each dimension.
You have many replies also and examples. It would help you. Probably when you have solved the issue, close the discussion.