Unlock a world of possibilities! Login now and discover the exclusive benefits awaiting you.
- Qlik Community
- :
- All Forums
- :
- QlikView App Dev
- :
- Chart
- Subscribe to RSS Feed
- Mark Topic as New
- Mark Topic as Read
- Float this Topic for Current User
- Bookmark
- Subscribe
- Mute
- Printer Friendly Page
- Mark as New
- Bookmark
- Subscribe
- Mute
- Subscribe to RSS Feed
- Permalink
- Report Inappropriate Content
Chart
Hi,
My chart uses only expressions.
In my chart, I want to display a Mini Chart that will show the average number of leads by selected day.
Is it possible to build a table with the following columns:
1. will display the number of leads,
2. will display the number of leads only to source 'Email',
3. will display the number of leads only to source 'online',
3. will display a Mini Chart showing the average number of leads by selected day
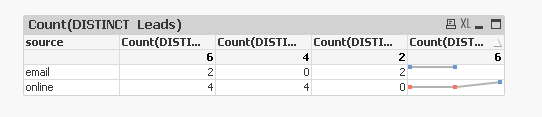
Attached is a picture of the Mini Chart i want to display
- « Previous Replies
-
- 1
- 2
- Next Replies »
- Mark as New
- Bookmark
- Subscribe
- Mute
- Subscribe to RSS Feed
- Permalink
- Report Inappropriate Content
What are you planning to use as your dimension here?
- Mark as New
- Bookmark
- Subscribe
- Mute
- Subscribe to RSS Feed
- Permalink
- Report Inappropriate Content
I don't want to use dimension.
the expressions will be on the Y axis.
There is an option to build such a table?
- Mark as New
- Bookmark
- Subscribe
- Mute
- Subscribe to RSS Feed
- Permalink
- Report Inappropriate Content
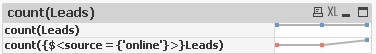
Something like this?
- Mark as New
- Bookmark
- Subscribe
- Mute
- Subscribe to RSS Feed
- Permalink
- Report Inappropriate Content
No,
in the QVW attached, there is an 'Incoming Report' chart, I want to add another column that will display the Mini Chart
is it possible?
- Mark as New
- Bookmark
- Subscribe
- Mute
- Subscribe to RSS Feed
- Permalink
- Report Inappropriate Content
I have not done this before, but hopefully someone else can help.
- Mark as New
- Bookmark
- Subscribe
- Mute
- Subscribe to RSS Feed
- Permalink
- Report Inappropriate Content
Hi
In pivot table, we can't able to create Mini chart.
Please close the thread by marking correct answer & give likes if you like the post.
- Mark as New
- Bookmark
- Subscribe
- Mute
- Subscribe to RSS Feed
- Permalink
- Report Inappropriate Content
Hi Tal Tal,
You can make a straight table like this:
Add a dimension : 1 (just the number one) and hide this column
Add your measures of choice. Make mini charts on the dimension date. Make totals mode No Totals.
In the presentation tab check the Horizontal box.
Good luck
Andrew
- Mark as New
- Bookmark
- Subscribe
- Mute
- Subscribe to RSS Feed
- Permalink
- Report Inappropriate Content
can You attach an example?
- Mark as New
- Bookmark
- Subscribe
- Mute
- Subscribe to RSS Feed
- Permalink
- Report Inappropriate Content
check attached
If a post helps to resolve your issue, please accept it as a Solution.
- « Previous Replies
-
- 1
- 2
- Next Replies »