Unlock a world of possibilities! Login now and discover the exclusive benefits awaiting you.
- Qlik Community
- :
- All Forums
- :
- QlikView App Dev
- :
- Chart
- Subscribe to RSS Feed
- Mark Topic as New
- Mark Topic as Read
- Float this Topic for Current User
- Bookmark
- Subscribe
- Mute
- Printer Friendly Page
- Mark as New
- Bookmark
- Subscribe
- Mute
- Subscribe to RSS Feed
- Permalink
- Report Inappropriate Content
Chart
Hi All,
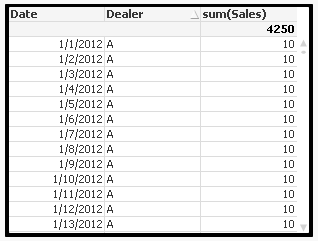
How to place chart in boxes as shown in attachment.
I just wanted to know what option we need to choose while designing chart .
Thanks,
Deepak
Accepted Solutions
- Mark as New
- Bookmark
- Subscribe
- Mute
- Subscribe to RSS Feed
- Permalink
- Report Inappropriate Content
You can use text box also for this
Take a text box fill with black background and in properties >> Layer set its layer properties bottom
like way set chart property top and place your chart on the text with extend the border width and height of text box some extend to chart. Try this trick with text box.
See the sample file
- Mark as New
- Bookmark
- Subscribe
- Mute
- Subscribe to RSS Feed
- Permalink
- Report Inappropriate Content
Its a border color use it as Black color.
- Mark as New
- Bookmark
- Subscribe
- Mute
- Subscribe to RSS Feed
- Permalink
- Report Inappropriate Content
And set Border Width > 0
- Mark as New
- Bookmark
- Subscribe
- Mute
- Subscribe to RSS Feed
- Permalink
- Report Inappropriate Content
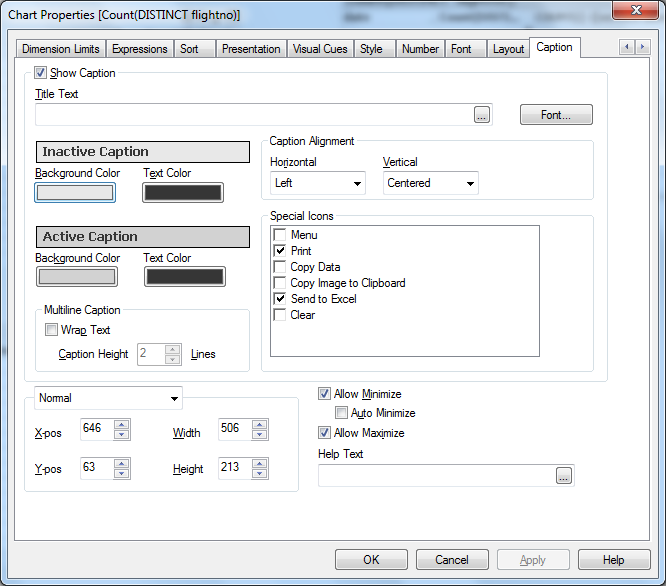
Go to chart properties -> caption -> inactive caption background color select black here do same for
active caption
See the attached sample
Yes border width atleast 1 and greater also remove caption from chart if not required
- Mark as New
- Bookmark
- Subscribe
- Mute
- Subscribe to RSS Feed
- Permalink
- Report Inappropriate Content
Container objects are good to use for this.
Well you can also use tricks like textbox object with border.
- Mark as New
- Bookmark
- Subscribe
- Mute
- Subscribe to RSS Feed
- Permalink
- Report Inappropriate Content
Go to
Settings >> Document Properties >> Styling Mode = Advanced
Now Go to
Chart Properties >> Layout >> Tick Use Border >> Select Color whatever you want >> Untick Rounded Corner
Color Tab >> Transparency 100%
- Mark as New
- Bookmark
- Subscribe
- Mute
- Subscribe to RSS Feed
- Permalink
- Report Inappropriate Content
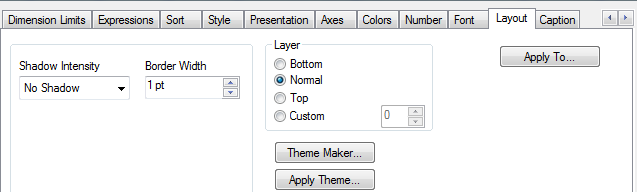
Layout Tab-> shadow Intensity >no Shadow
Border Width->1
InCaption Change the active and inactive caption background the color u like
- Mark as New
- Bookmark
- Subscribe
- Mute
- Subscribe to RSS Feed
- Permalink
- Report Inappropriate Content
Chart ->Right click->Properties->Layout->Show Intensity->Select->No Shadow ->Select Your Bar Width->1 or 2
->And ->Go to ->Caption->
Get Color like This
eg

- Mark as New
- Bookmark
- Subscribe
- Mute
- Subscribe to RSS Feed
- Permalink
- Report Inappropriate Content
Hi,
with reference to your attached image you can hide caption and from layout tab you can select border width>0 with border colour as black.
- Mark as New
- Bookmark
- Subscribe
- Mute
- Subscribe to RSS Feed
- Permalink
- Report Inappropriate Content
You can use text box also for this
Take a text box fill with black background and in properties >> Layer set its layer properties bottom
like way set chart property top and place your chart on the text with extend the border width and height of text box some extend to chart. Try this trick with text box.
See the sample file